The so-called Covid “supermodel” commissioned by the Govt of India is fundamentally flawed.
Not surprising, since it was built by people who had no clue about epidemiology or public health (the Govt ignored the advice of *actual* public health experts).
See for yourself. Thread
Not surprising, since it was built by people who had no clue about epidemiology or public health (the Govt ignored the advice of *actual* public health experts).
See for yourself. Thread
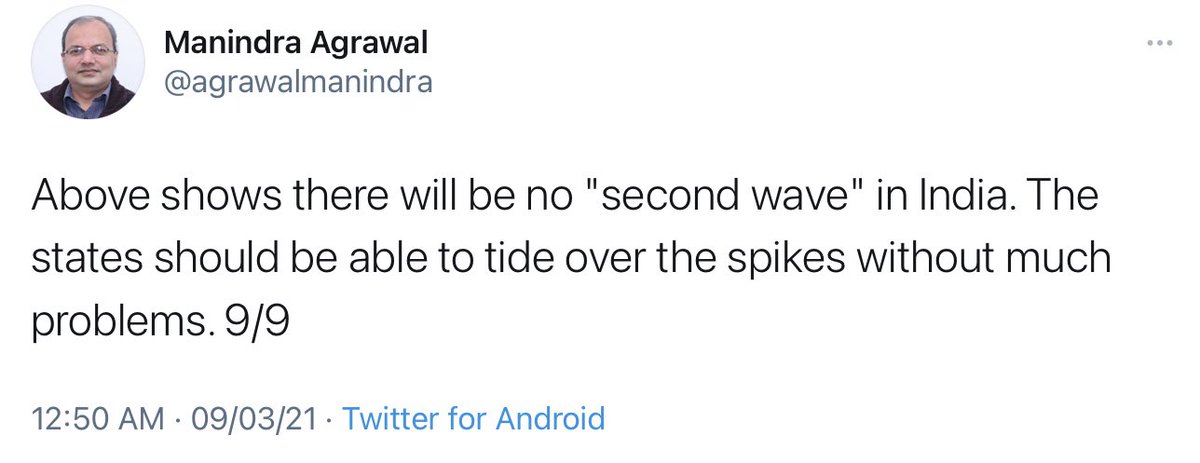
On 09/03/21 they explicitly predicted there would be no “second wave”.
OK, models can get their predictions wrong. Presumably, once it became clear there was a raging second wave, the model builders would admit their model was flawed, right?
Wrong.
OK, models can get their predictions wrong. Presumably, once it became clear there was a raging second wave, the model builders would admit their model was flawed, right?
Wrong.
The basis for the claim of “no second wave” is this projection from 09/03/21. It predicts a “gentle increase” followed by a “gentle decline”, peaking at about 30,000 cases per day.
Once you make a prediction, you either stick by it, or admit the model is wrong. But ...
Once you make a prediction, you either stick by it, or admit the model is wrong. But ...

What do we have here? A projection on 25/03/21 that India will peak at “between 70-80K new infections per day”. OK, just off by a factor of two, maybe not enough to admit any flaws.
Let’s hope they stick to this prediction.
Oh wait ...
Let’s hope they stick to this prediction.
Oh wait ...

At least they’re “embarrassed” that they failed to predict a second wave <smiley face>. “Of course,” they say, “this wave is being driven primarily by Maharashtra”.
Maybe good to let the Govt know that they should not making policy based on these predictions?
Maybe good to let the Govt know that they should not making policy based on these predictions?

Three days later, 28/03/21. Hey the data are matching our predictions <smiley face>! It’s all good, you can trust us. Well, the peak has gone up to 85K per day, but what’s a few percent error between friends.
Final prediction?
No ...
Final prediction?
No ...

02/04/21. Yes we admit there is a second wave. But don’t worry, the peak will be at 100K infections per day.
Final prediction?
Final prediction?

Oh no, two days later on 04/04/21, “the peak keeps going up”!
What does this even mean? Why not say “our prediction was wrong”?
Is this a good time to introspect that there’s something fundamentally flawed about the “supermodel”, whose predictions change from day to day?
What does this even mean? Why not say “our prediction was wrong”?
Is this a good time to introspect that there’s something fundamentally flawed about the “supermodel”, whose predictions change from day to day?

One day later, 05/04/21. Predicted peak has shifted to 114K per day.
Recall that the 04/04/21 prediction was 110K per day. Where did 78K come from? Apparently the predictions are changing so rapidly they are now making more than one prediction per day.
Recall that the 04/04/21 prediction was 110K per day. Where did 78K come from? Apparently the predictions are changing so rapidly they are now making more than one prediction per day.

Let’s shift goalposts. Let’s say we got it correct as long as we predicted the *timing* of the peak correctly, since we clearly have no idea what we are doing about the actual case load.
“Will keep a count <smiley face>”.
“Will keep a count <smiley face>”.

07/04/21. “Peak value for India keeps rising! It is now 150K”.
But don’t worry, we’re now only predicting the timing. We predict a peak Apr 21-25, and we’re sticking with this prediction.
But don’t worry, we’re now only predicting the timing. We predict a peak Apr 21-25, and we’re sticking with this prediction.

One week later, 14/04/21. Peak now at 190K but hey, we’re sticking to the Apr 20-25 prediction.
Here’s a nice touch: “The date of turning will decide the value of the peak.” I.e. I’ll only predict the peak caseload once we’re past the peak!
Here’s a nice touch: “The date of turning will decide the value of the peak.” I.e. I’ll only predict the peak caseload once we’re past the peak!

Well, we’re past Apr 20-25 and still nowhere near the peak. Yesterday we saw 4,01,991 cases, far above *any* of the predictions of the so-called “supermodel”.
Is it now time to retire the supermodel and turn to advice from genuine public health experts? Apparently not.
Is it now time to retire the supermodel and turn to advice from genuine public health experts? Apparently not.

It is not my intent to pick on one individual. Manindra Agarwal is a respected scientist in his field, but he is not an epidemiologist.
The main fault lies with the Govt, for ignoring true experts and turning to non-experts, who told them what they wanted to hear.
The main fault lies with the Govt, for ignoring true experts and turning to non-experts, who told them what they wanted to hear.
(Apologies for the mis-spelling, it should be Manindra *Agrawal*.)
• • •
Missing some Tweet in this thread? You can try to
force a refresh