
Here are the latest COVID-19 data for Alberta:
• 1,714 new cases (1,731 net w/adjustments to past days)
• 22,920 active cases
• 648 in hospital w/ 155 in ICU
• 3 more death. 2,086 total now.
More charts & context: cbc.ca/news/canada/ca…
• 1,714 new cases (1,731 net w/adjustments to past days)
• 22,920 active cases
• 648 in hospital w/ 155 in ICU
• 3 more death. 2,086 total now.
More charts & context: cbc.ca/news/canada/ca…


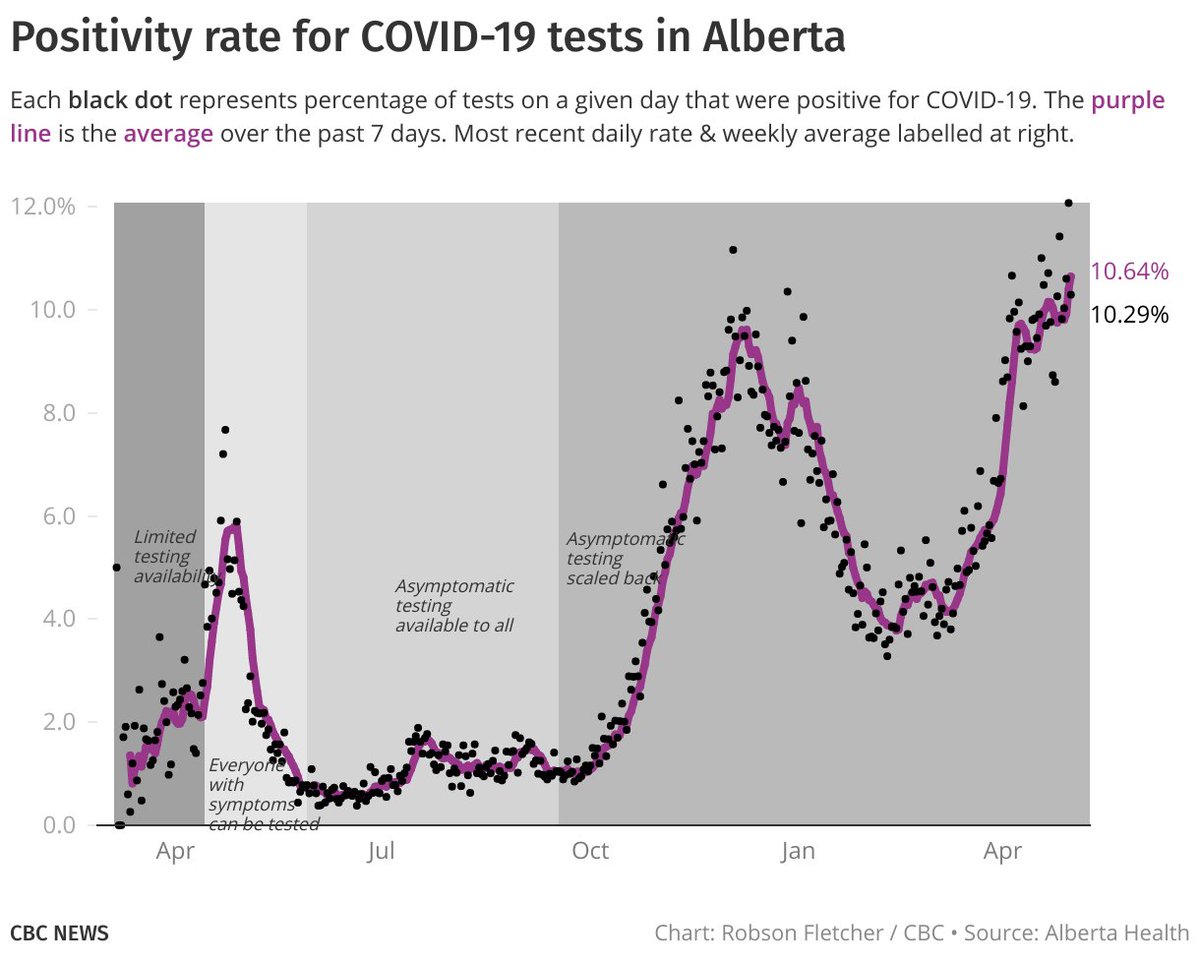
Testing data:
• 10.3% positivity provincewide yesterday.
• North zone still has the highest average positivity over the past week
• 10.3% positivity provincewide yesterday.
• North zone still has the highest average positivity over the past week

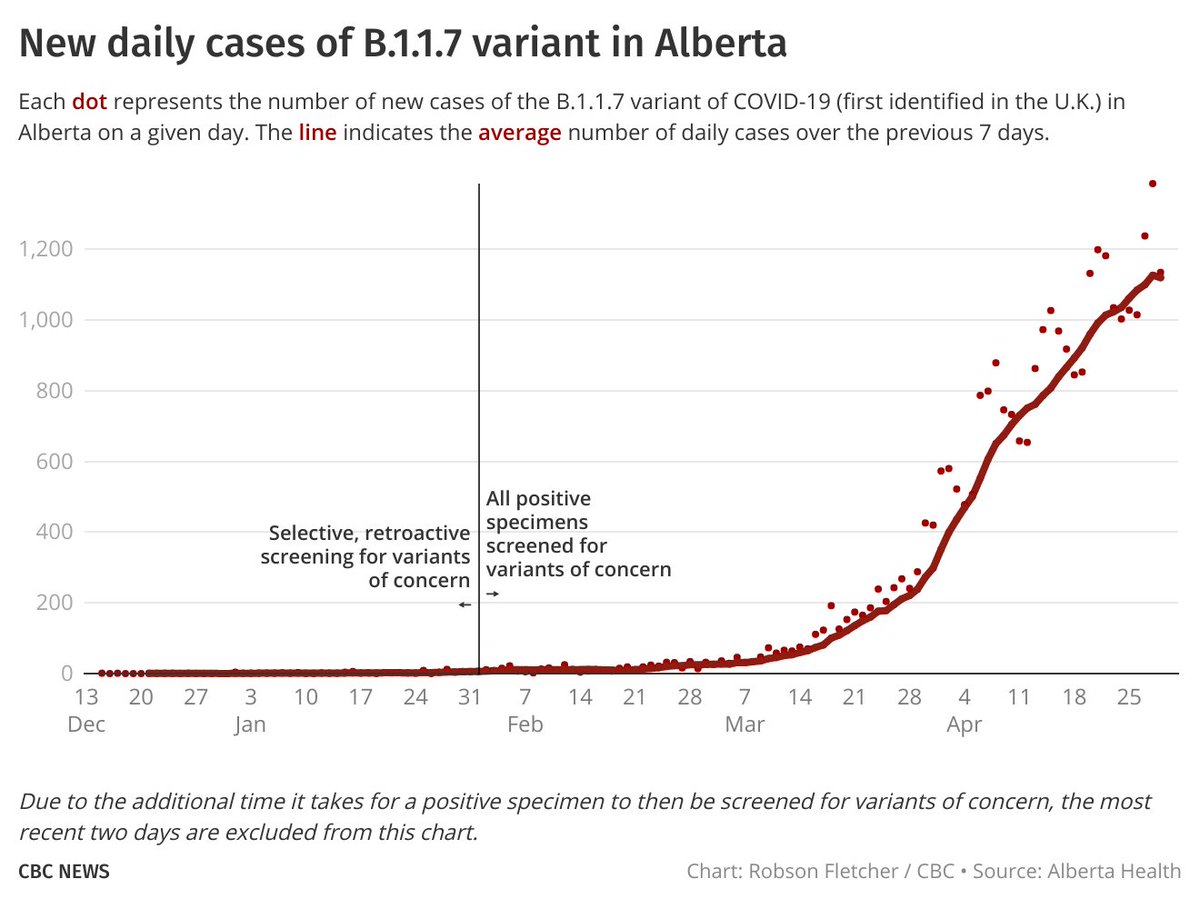
Variants-of-concern data.
I'm including the same charts I've been using for the past while but will soon have to change or discontinue these because, as of May 1, Alberta is no longer screening all samples for variants: cbc.ca/news/canada/ca…
I'm including the same charts I've been using for the past while but will soon have to change or discontinue these because, as of May 1, Alberta is no longer screening all samples for variants: cbc.ca/news/canada/ca…


Vaccination data:
• Total doses distributed & administered
• Daily doses administered
• % of pop. with at least 1 dose & fully immunized (2 doses)
• Total doses distributed & administered
• Daily doses administered
• % of pop. with at least 1 dose & fully immunized (2 doses)


Geographic data:
• Active cases by zone
• Top 10 local health areas for active cases
• Top 10 local health areas for active-case RATES (adjusted for population)
• Active cases by zone
• Top 10 local health areas for active cases
• Top 10 local health areas for active-case RATES (adjusted for population)


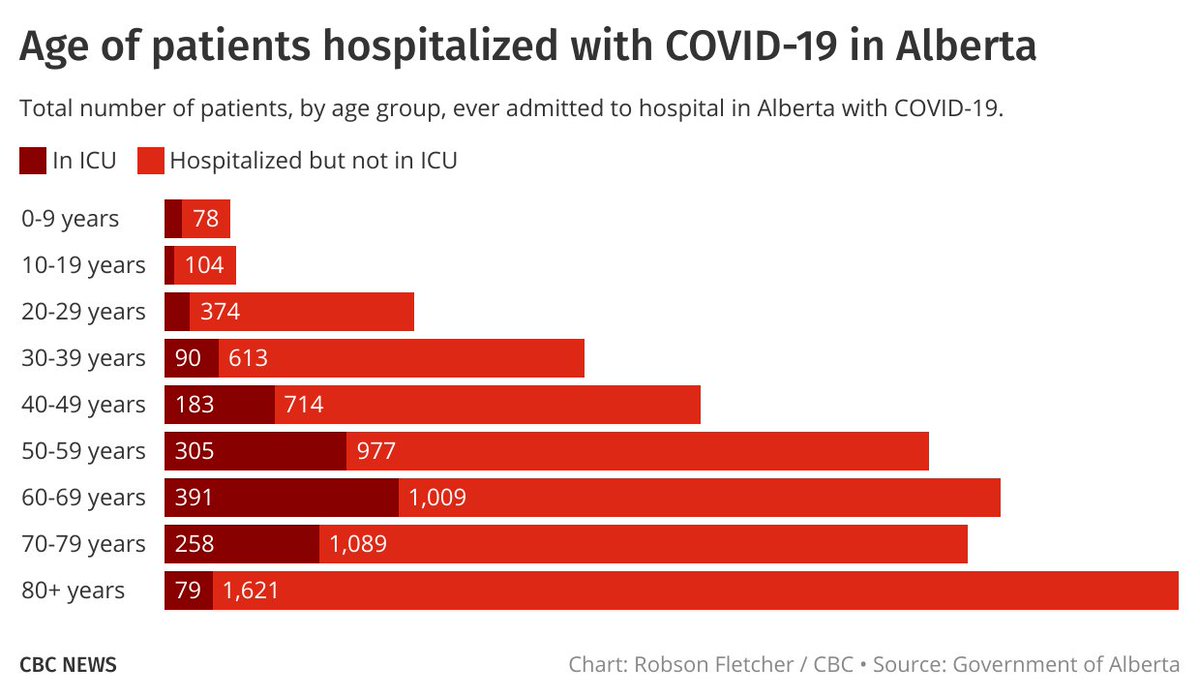
The latest age-based data:
• New weekly COVID-19 cases by 10-year age range. (With new week added: Week ending May 1.)
• Average daily new cases by 20-year age range, adjusted for population size.
• Distribution of patients (ever) hospitalized
• Cases by current status
• New weekly COVID-19 cases by 10-year age range. (With new week added: Week ending May 1.)
• Average daily new cases by 20-year age range, adjusted for population size.
• Distribution of patients (ever) hospitalized
• Cases by current status


• • •
Missing some Tweet in this thread? You can try to
force a refresh


