We updated @my_helix viral surveillance dashboards.
- SGTF dashboard still here => important to see in real time if a variant is outcompeting B.1.1.7 in some states
- Selected variants dashboard. You can see P.1, B.1.617.2 & others. public.tableau.com/profile/helix6…
- SGTF dashboard still here => important to see in real time if a variant is outcompeting B.1.1.7 in some states
- Selected variants dashboard. You can see P.1, B.1.617.2 & others. public.tableau.com/profile/helix6…
2/
Using the SGTF dashboard:
public.tableau.com/profile/helix6…
In some states like FL, SGTF 5-day avg is 📉 66% on May 9 compared to 71% 10 days before. & SGTF likely still >95% B.1.1.7
So what is the 34% and maybe growing?
Using the SGTF dashboard:
public.tableau.com/profile/helix6…
In some states like FL, SGTF 5-day avg is 📉 66% on May 9 compared to 71% 10 days before. & SGTF likely still >95% B.1.1.7
So what is the 34% and maybe growing?

3/
You can look at the variants dashboard. It shows sequencing results.
public.tableau.com/profile/helix6…
See overall trend. And counts by state (click on specific variant).
Here, we observed 237 counts of P.1. in FL.
You can look at the variants dashboard. It shows sequencing results.
public.tableau.com/profile/helix6…
See overall trend. And counts by state (click on specific variant).
Here, we observed 237 counts of P.1. in FL.

4/
Trend in Florida for all vars. And we know B.1.1.7 decreasing ~5% as of May 9. Likely P.1. will be growing to 10-15%, but maybe it is B.1.617.2 appearing or other?
Trend in Florida for all vars. And we know B.1.1.7 decreasing ~5% as of May 9. Likely P.1. will be growing to 10-15%, but maybe it is B.1.617.2 appearing or other?

5/
Forgot to mention, that you can see actual counts per day if you scroll over the bar.
ex in screenshot below. P1 represents 10.42% of 144 sequences in FL from samples collected on April 19.
Link: public.tableau.com/profile/helix6…
Thanks @simonjwhite71 for the magic behind
Forgot to mention, that you can see actual counts per day if you scroll over the bar.
ex in screenshot below. P1 represents 10.42% of 144 sequences in FL from samples collected on April 19.
Link: public.tableau.com/profile/helix6…
Thanks @simonjwhite71 for the magic behind

6/ Also be careful when looking at the most recent day. Data is usually incomplete for the most recent day reported.
7/
Some interesting points.
In PA, B.1.526 is holding pretty well compared to B.1.1.7.
Some interesting points.
In PA, B.1.526 is holding pretty well compared to B.1.1.7.

8/
In Michigan, B.1.526.1 seems to be the variant that is the last to keep up with B.1.1.7.
In Michigan, B.1.526.1 seems to be the variant that is the last to keep up with B.1.1.7.

9/
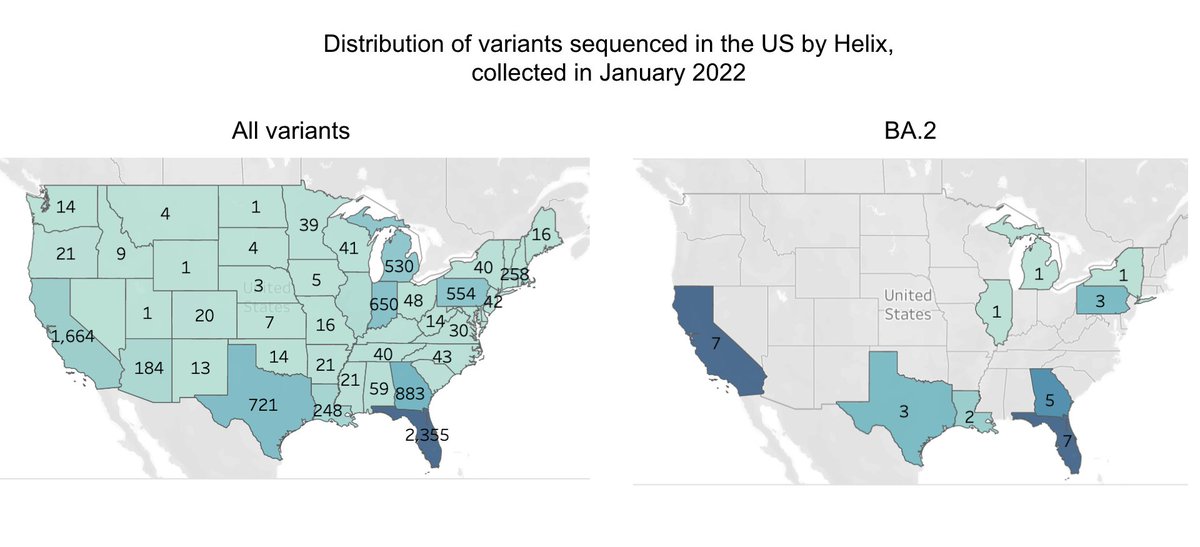
For B.1.617.2, we observed 30 (see distribution 👇). Not enough to make any hypothesis.
Some great threads today by @theosanderson & @TWenseleers on this variant.
For B.1.617.2, we observed 30 (see distribution 👇). Not enough to make any hypothesis.
Some great threads today by @theosanderson & @TWenseleers on this variant.

• • •
Missing some Tweet in this thread? You can try to
force a refresh