
1/ Thread: Customer-based Corporate Valuation
@mjmauboussin and Callahan recently published a piece highlighting Customer-based Corporate Valuation (CBCV) which works particularly well for subscription businesses.
Here are my notes.
@mjmauboussin and Callahan recently published a piece highlighting Customer-based Corporate Valuation (CBCV) which works particularly well for subscription businesses.
Here are my notes.
2/ Subscription based businesses’ topline grew 17.8% in 2012-2020 period whereas S&P 500 grew sales ~2% during the same time.
Digital subscription has also expanded TAM significantly for some businesses.
$NYT print subscription in 1996: 1.1 mn vs digital subs in 2021: 5.3 mn
Digital subscription has also expanded TAM significantly for some businesses.
$NYT print subscription in 1996: 1.1 mn vs digital subs in 2021: 5.3 mn
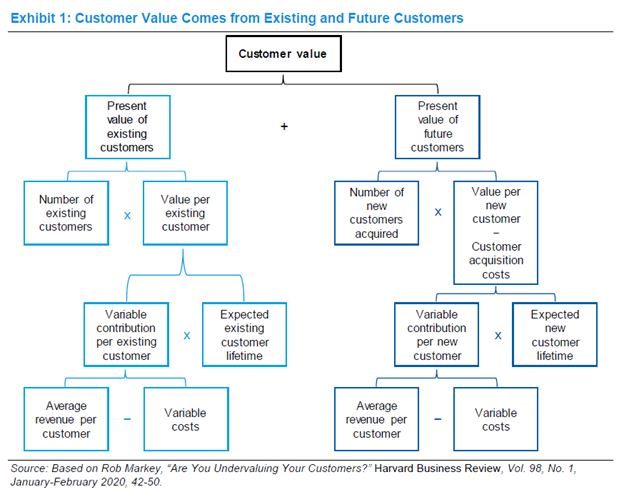
3/ The CBCV framework appears simple: customer value comes from existing and future customers. Of course, the devil is the details.
Let’s get to it.
Let’s get to it.
4/ Customers
As you can gauge, customers are at the heart of CBCV framework.
In order to assess the opportunity, we need to have a good understanding of current customers but more importantly, the size of future customers.
As you can gauge, customers are at the heart of CBCV framework.
In order to assess the opportunity, we need to have a good understanding of current customers but more importantly, the size of future customers.
5/ How do we increase TAM?
“One way to increase the TAM is to figure out how to convert near customers, who are close to buying the good or service, into customers”
“Rivalry has countervailing effects on a market. On the one hand, competitors tend to draw resources to the...
“One way to increase the TAM is to figure out how to convert near customers, who are close to buying the good or service, into customers”
“Rivalry has countervailing effects on a market. On the one hand, competitors tend to draw resources to the...

6/ "...market. That accelerates adoption.
On the other hand, competition tends to hurt profitability in the short run. The same promotions that generate customer growth also penalize CLV through lower profits and higher CACs.”
On the other hand, competition tends to hurt profitability in the short run. The same promotions that generate customer growth also penalize CLV through lower profits and higher CACs.”
7/ It is a grave mistake to assume customers are a homogeneous bunch. Innovators and early adopters have low CAC, but as you move to “early majority” and “late majority”, CAC tends to rise and profitability per customer falls.


8/ With time, adoption curve in technology has accelerated.
Time required for 1 Bn MAU:
Facebook: 8 yrs
WhatsApp: 7 yrs
WeChat: 6 yrs
TikTok: 2.5 yrs
Time required for 1 Bn MAU:
Facebook: 8 yrs
WhatsApp: 7 yrs
WeChat: 6 yrs
TikTok: 2.5 yrs

9/ Why has the adoption accelerated?
Relative advantage, visibility, trialability, simplicity, and compatibility.
See image for explanation.
Relative advantage, visibility, trialability, simplicity, and compatibility.
See image for explanation.


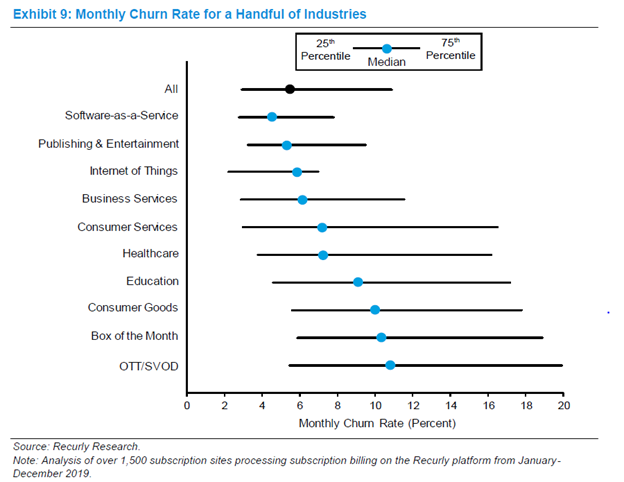
10/ Of course, churn rate is of paramount importance for any subscription business.
The median monthly churn rate across industries is 5.5%, with SaaS being lowest (4.6%) and SVOD being highest (10.8%).
Good to know MBI Deep Dives' churn is at par with SaaS.
The median monthly churn rate across industries is 5.5%, with SaaS being lowest (4.6%) and SVOD being highest (10.8%).
Good to know MBI Deep Dives' churn is at par with SaaS.
11/ “A 5-percentage point increase in annual customer retention increased the CLVs for a number of industries by an average of 75%.
one percentage point improvement in retention added more to CLV than an equivalent improvement in acquisition cost and operating profit margin"
one percentage point improvement in retention added more to CLV than an equivalent improvement in acquisition cost and operating profit margin"

12/ If customer spending by cohort increases with time, you know things are in the right direction.
Here's an example of $CPNG.
Here's an example of $CPNG.

13/ Given the importance of churn, NPS can be a good indicator of customer satisfaction/retention rate. Anything above 70 is excellent and 30-70 is very good.
CBCV can be particularly helpful in predicting revenue growth. Here’s how the bottom up model looks like.
CBCV can be particularly helpful in predicting revenue growth. Here’s how the bottom up model looks like.


14/ A common mistake is to assume constant retention rate in each cohort, but in reality retention rate in a particular cohort tends to increase with time. Assuming constant retention rate can lead to 25-50% undervaluation of a customer cohort.

15/A study found 20% customers generated 67% of revenues of a sample of 340 public companies.
Non-subscription businesses tend to be better at extracting value out of their “best” customers. Distribution of CLV, especially for non-subscription businesses is very lopsided.
Non-subscription businesses tend to be better at extracting value out of their “best” customers. Distribution of CLV, especially for non-subscription businesses is very lopsided.
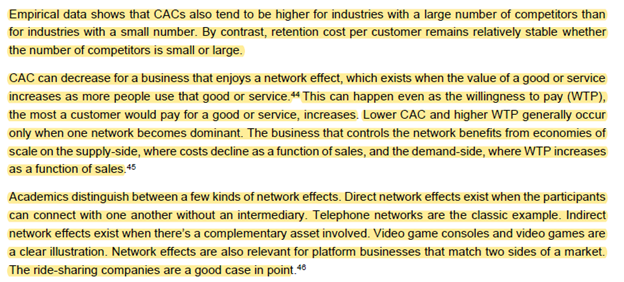
16/ As mentioned earlier, CAC tends to rise with time as you move from early adopters to early majority unless, of course, you have network effects.

17/ One major difference between LTV/CAC and CBCV framework is unlike LTV/CAC, all costs are considered in CBCV. Since you don’t consider all costs and capex, LTV/CAC relies too much on heuristics.

18/ How companies add value
Two important concepts to consider here: Willingness to Pay (WTP) and Willingness to Sell (WTS)
Two important concepts to consider here: Willingness to Pay (WTP) and Willingness to Sell (WTS)

19/ “companies should focus less on how to create more sales and more on how to delight their customers so as to increase WTP. This is important because the research suggests that higher consumer surplus leads to higher customer retention, hence linking directly to CLV”
20/ How do you increase WTP?
Here are three ways. (See images)
Here are three ways. (See images)


21/ How do you increase WTS?
Here are two ways (see images)
Here are two ways (see images)

End/ Mauboussin and Callahan then provided an example (AT&T) to illustrate the CBCV framework.
Link to the full research: morganstanley.com/im/en-us/indiv…
All my twitter threads: mbi-deepdives.com/twitter-thread…
Link to the full research: morganstanley.com/im/en-us/indiv…
All my twitter threads: mbi-deepdives.com/twitter-thread…
• • •
Missing some Tweet in this thread? You can try to
force a refresh


