Is containing COVID-19 a requirement for preserving the economy? My analysis suggests: probably not.
In the US, there is no correlation between Covid deaths & changes in unemployment rates.
However, blue states are much more likely to have higher increases in unemployment.
🧵
In the US, there is no correlation between Covid deaths & changes in unemployment rates.
However, blue states are much more likely to have higher increases in unemployment.
🧵

We can dive deeper by looking at levels of restrictions in each state, using the Oxford Covid-19 Government Response Tracker (OxCGRT).
More restrictions in a state is NOT correlated with fewer COVID-19 deaths.
However, more restrictions IS correlated with higher unemployment.
More restrictions in a state is NOT correlated with fewer COVID-19 deaths.
However, more restrictions IS correlated with higher unemployment.


The most interesting data point is South Dakota.
As the only state to never order closures of restaurants, bars & retail, SD actually saw a 0.5% DECREASE in unemployment since the pandemic started. It also never ordered a mask mandate.
Its deaths per capita is the 10th highest.
As the only state to never order closures of restaurants, bars & retail, SD actually saw a 0.5% DECREASE in unemployment since the pandemic started. It also never ordered a mask mandate.
Its deaths per capita is the 10th highest.
As we all know, the level of restrictions is strongly correlated with the political leaning of a state.
Putting it all together, it's possible more restrictions can explain why blue states saw higher unemployment increases since the start of the pandemic than red states.
Putting it all together, it's possible more restrictions can explain why blue states saw higher unemployment increases since the start of the pandemic than red states.


But interestingly, political lean (and level of restrictions) is NOT correlated with total Covid deaths.
Regardless of one's political beliefs, the data does not support that blue states did better than red states at containing Covid, or vice versa.
Regardless of one's political beliefs, the data does not support that blue states did better than red states at containing Covid, or vice versa.

Even if you remove the Northeast states that were hard-hit early on in 2020 (NY, NJ, CT, MA), the correlation is still very weak.
While not a concrete proof, this supports the theory that the virus is inherently unpredictable, regardless of restrictions, political beliefs, etc.
While not a concrete proof, this supports the theory that the virus is inherently unpredictable, regardless of restrictions, political beliefs, etc.

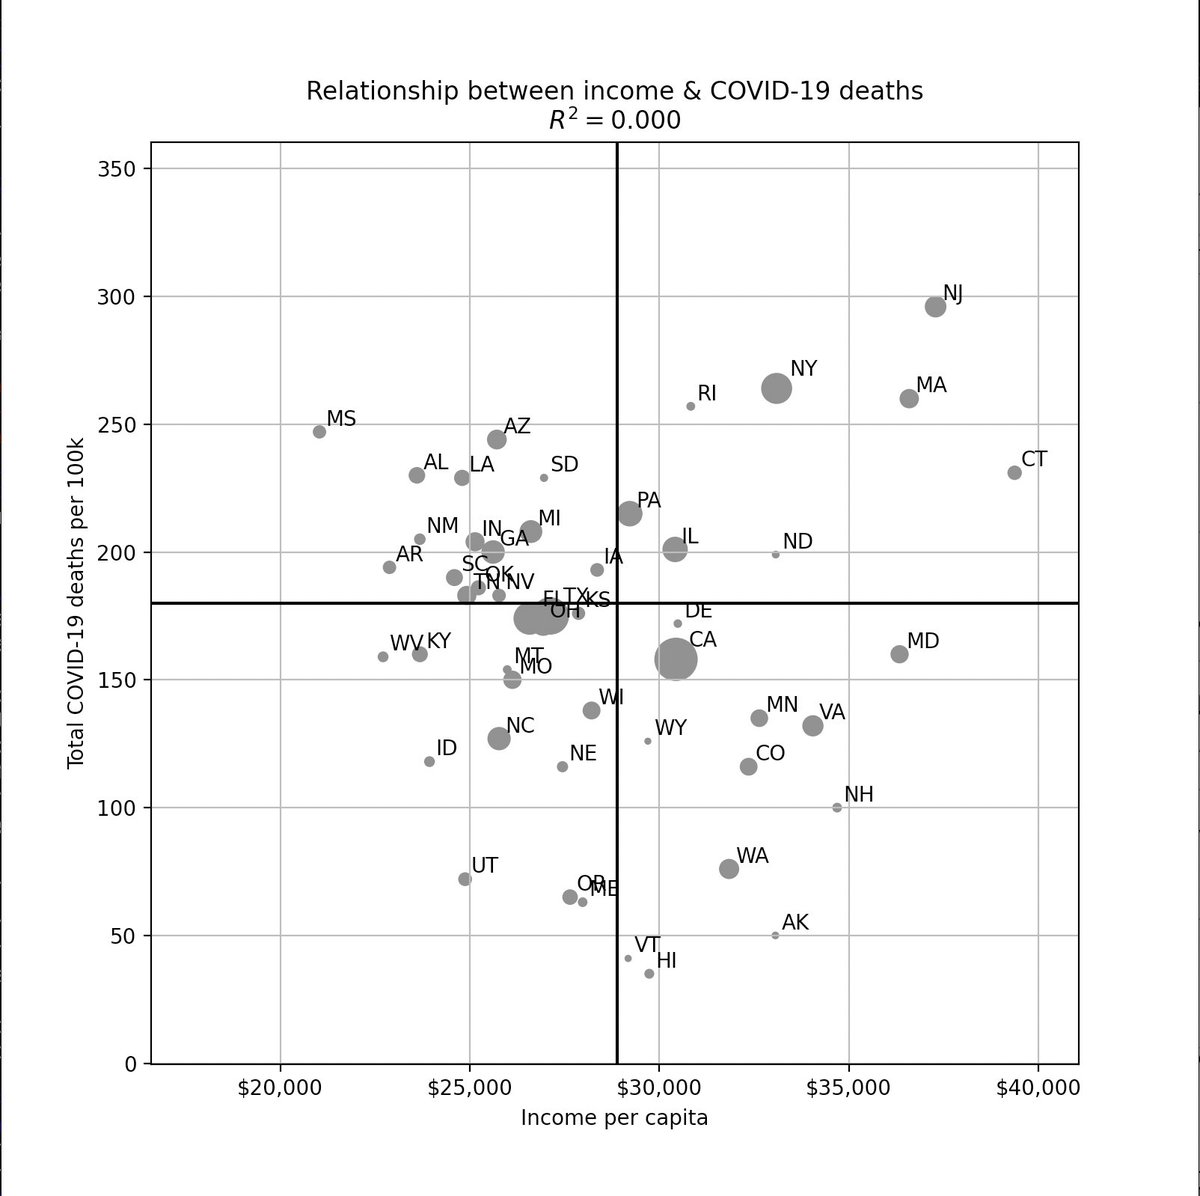
Here are a few other factors I looked at: age, population density, urban vs rural, and income. All show no or minimal correlations with deaths.
If you had showed me this data before the pandemic, I would've expected a much higher correlation. But we must adapt to new data.
If you had showed me this data before the pandemic, I would've expected a much higher correlation. But we must adapt to new data.


There is a common belief among many that restrictions are universally effective in containing Covid, and that containment is a prerequisite to preserving the economy.
At least in the US, the data does not appear to support this theory.
At least in the US, the data does not appear to support this theory.
Note of caution: this analysis abstracts the nuances in each state. For example, some states had no choice but to enact strict restrictions.
And of course, the impact of Covid on the economy is a complicated issue and cannot be boiled down into a few graphs or Tweets.
And of course, the impact of Covid on the economy is a complicated issue and cannot be boiled down into a few graphs or Tweets.
This is a just a simple analysis, but I hope we can view this data with an unbiased approach and learn from it.
All of the data I presented here can be found on my GitHub: github.com/youyanggu/covi…
All of the data I presented here can be found on my GitHub: github.com/youyanggu/covi…
To conclude, I believe it's important that we avoid politically-driven narratives like "state X is wrong and should've followed state Y's example".
The science does not support a "one solution fits all" approach, and what works for some states may not work for others.
/END
The science does not support a "one solution fits all" approach, and what works for some states may not work for others.
/END
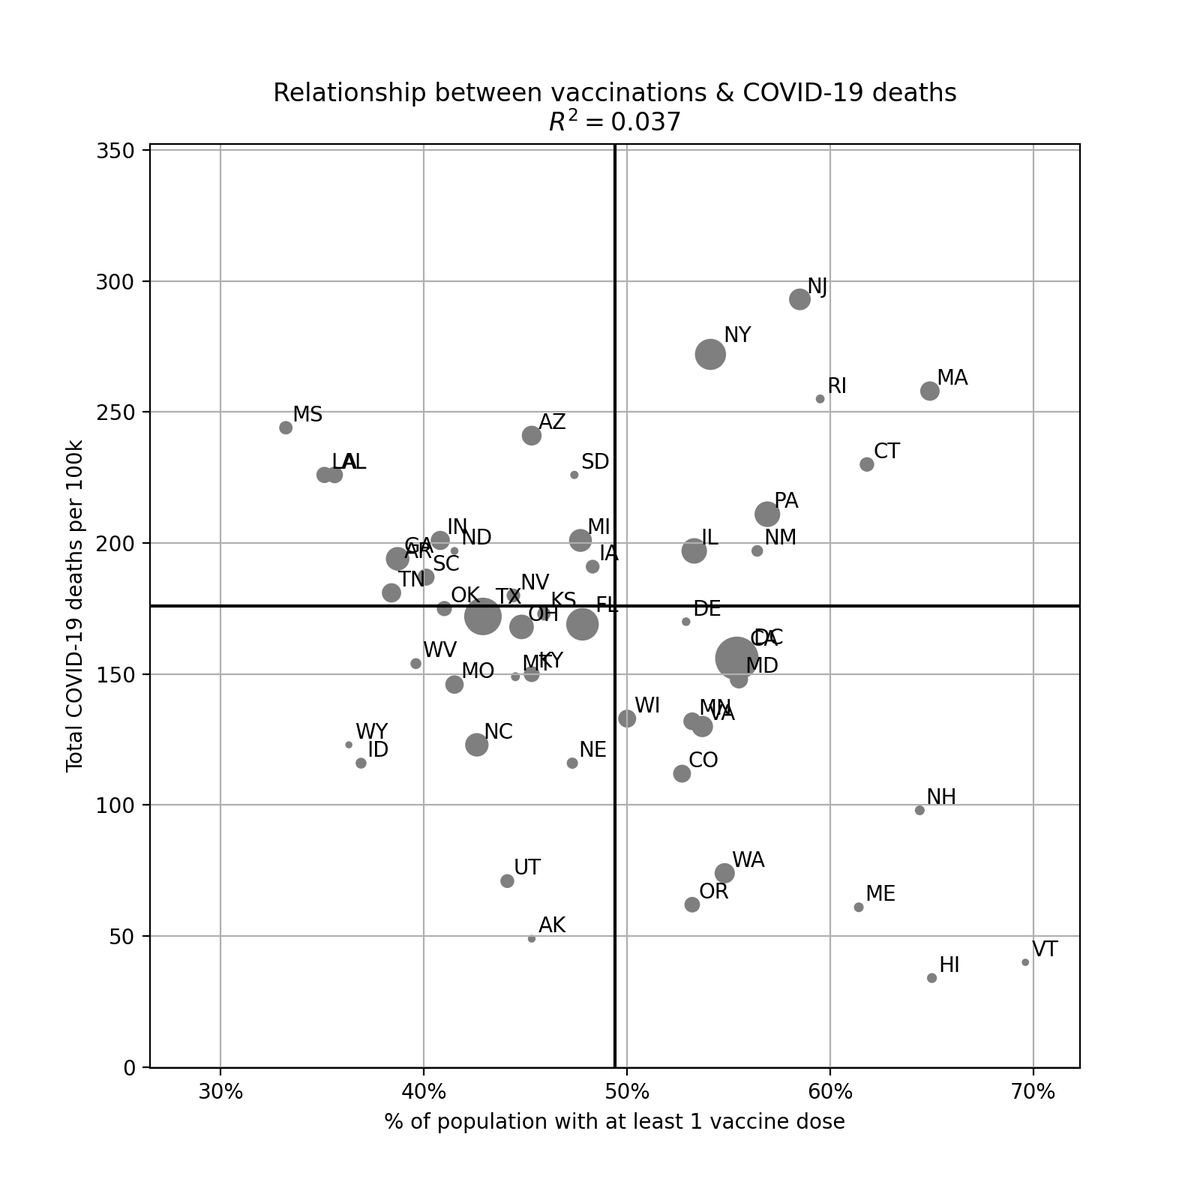
Update: I looked at a few more correlations based on the feedback: weather, education, % blue collar jobs, and vaccination status.
As many also mentioned, correlation != causation. But the lack of correlations here suggests that luck + randomness may play a large role.
As many also mentioned, correlation != causation. But the lack of correlations here suggests that luck + randomness may play a large role.


Here's another good takeaway: If you look at the bottom left quadrant (low deaths + low unemployment), the states that fared well are a mix of blue, red, and purple states.
Perhaps we can learn from the states that did well regardless of their politics.
Perhaps we can learn from the states that did well regardless of their politics.

Update #2: Note that I’m not disagreeing with studies that say restrictions reduce Covid cases/deaths in the *short term*.
But *eventually* you have to relax those measures, & states with more restrictions will be more susceptible to the next wave, leading to more restrictions.
But *eventually* you have to relax those measures, & states with more restrictions will be more susceptible to the next wave, leading to more restrictions.
Update #3: Some people noted that my analysis is subject to endogeneity/reverse causality. It’s a fair critique, though here’s why I don’t think it’s a significant issue:
1. I show a lack of correlation.
2. Relative ordering of restriction levels are ~constant over time (ex ⬇️).
1. I show a lack of correlation.
2. Relative ordering of restriction levels are ~constant over time (ex ⬇️).

While some suggested there can be confounding variables I didn’t consider, I still have yet to find any variable that has significant predictive power for total Covid deaths by state.
Below, I included two more variables I looked at: obesity rates & % minority population.
Below, I included two more variables I looked at: obesity rates & % minority population.


To reduce misinterpretation: I believe restrictions are effective in certain situations such as during surges to preserve healthcare capacity.
Outside of those, I think the evidence for their effectiveness is low, especially since most states are reactive rather than proactive.
Outside of those, I think the evidence for their effectiveness is low, especially since most states are reactive rather than proactive.
June 22 Update: Here is my follow-up analysis on this topic with more variables and multivariate regressions:
https://twitter.com/youyanggu/status/1407418434955005955
• • •
Missing some Tweet in this thread? You can try to
force a refresh