NEW: B.1617.2 is fuelling a third wave in the UK, with not only cases but also hospital admissions rising.
Vaccines will make this wave different to those that have come before, but it remains a concern, and one that other countries will soon face.
Thread on everything we know:
Vaccines will make this wave different to those that have come before, but it remains a concern, and one that other countries will soon face.
Thread on everything we know:
First, cases in the UK.
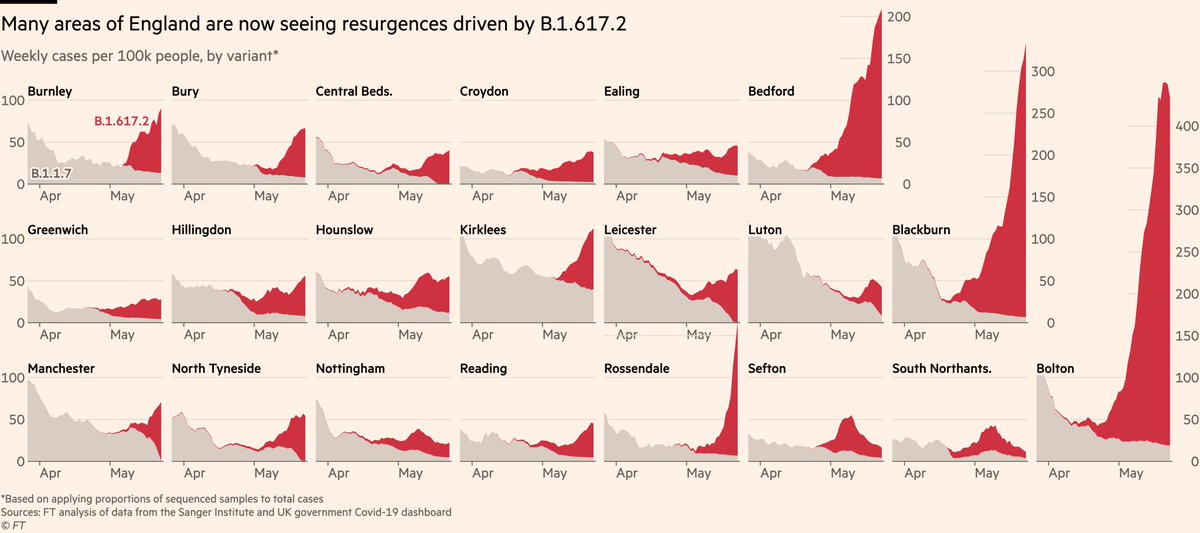
It’s been clear for some time that B.1.617.2 has been driving local outbreaks in North West of England, but data suggest it’s now far more widespread.
By mapping sequence prevalence onto total cases, we can see how the new variant is behind recent spikes
It’s been clear for some time that B.1.617.2 has been driving local outbreaks in North West of England, but data suggest it’s now far more widespread.
By mapping sequence prevalence onto total cases, we can see how the new variant is behind recent spikes

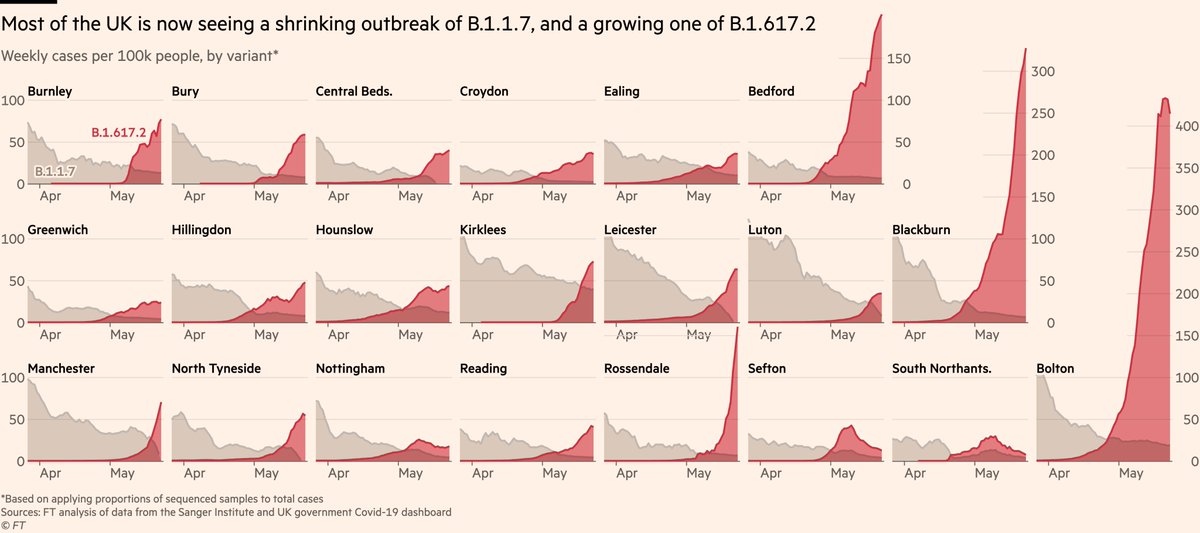
If we plot B.1.1.7 and B.1.617.2 on a common baseline, most areas show a shrinking outbreak of B.1.1.7 alongside a growing one of B.1.617.2.
What looks like "cases are flat", is probably "one going down, other going up, and it has more room to grow than the other has to shrink".
What looks like "cases are flat", is probably "one going down, other going up, and it has more room to grow than the other has to shrink".
Two things to note at this point:
First, it’s not clear everywhere will follow Bolton, Blackburn, Bedford. They absolutely could (and 👀 Rossendale), but it’s also possible conditions in those areas favoured more rapid spread than elsewhere.
First, it’s not clear everywhere will follow Bolton, Blackburn, Bedford. They absolutely could (and 👀 Rossendale), but it’s also possible conditions in those areas favoured more rapid spread than elsewhere.
For example we know Bolton’s outbreak initially flared in neighbourhoods where vaccine uptake was moderately low. Pointing this out is not to blame individuals, but to demonstrate how local contexts matter in outbreaks.
Other areas e.g Sefton saw spikes become bumps.
Other areas e.g Sefton saw spikes become bumps.
Second thing to note, and first sign that vaccines will fundamentally change this wave:
Case rates are staying low among older, mostly-fully-vaxxed age groups
No indication this pattern is changing, and it supports evidence from @PHE_uk that two doses stand up well to B.1.617.2
Case rates are staying low among older, mostly-fully-vaxxed age groups
No indication this pattern is changing, and it supports evidence from @PHE_uk that two doses stand up well to B.1.617.2
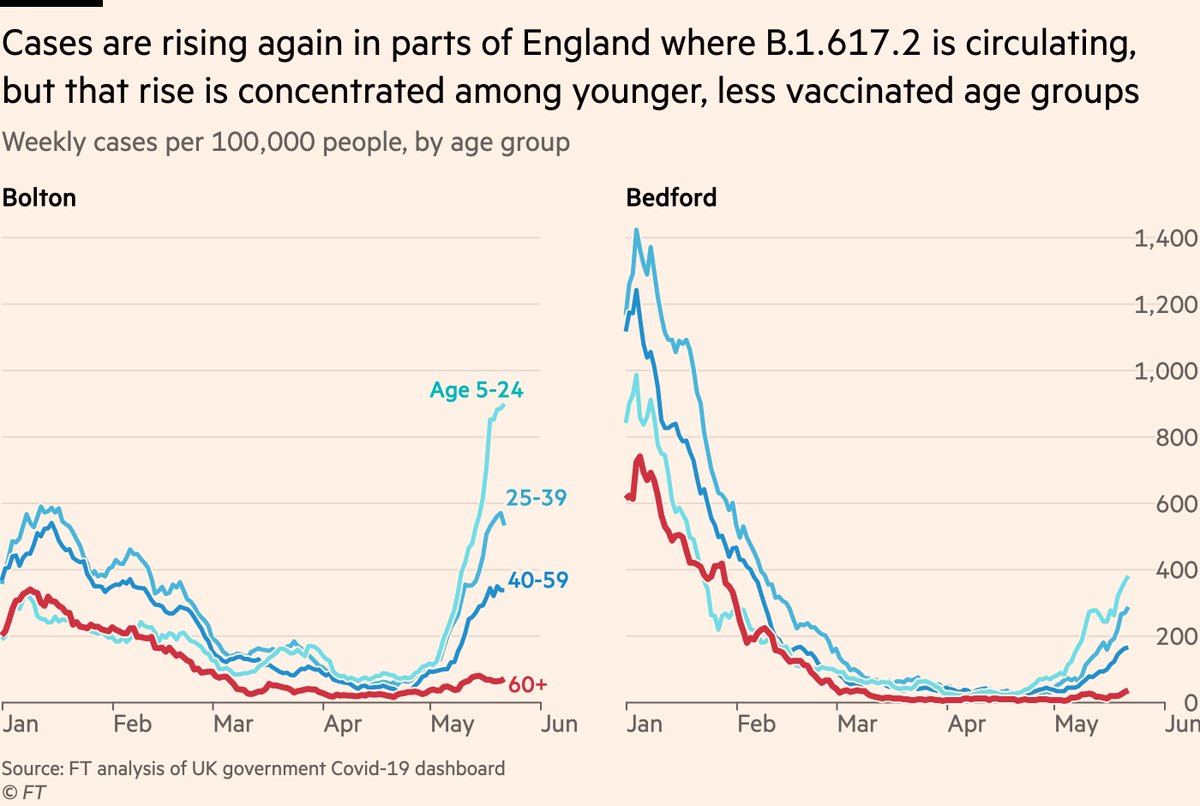
And this really matters when we move onto the more critical metrics, like hospital admissions and deaths.
If you have two waves of cases of equal volume, and one has a much younger age profile, it will result in much fewer deaths.
We can use Bolton to illustrate exactly this.
If you have two waves of cases of equal volume, and one has a much younger age profile, it will result in much fewer deaths.
We can use Bolton to illustrate exactly this.
Since April 1 there have 3,387 cases in Bolton. In the same length of time during last autumn’s wave, there were 3,386
But while last year 3,386 cases became an estimated 35 deaths, this year we can use age-specific-CFRs to estimate they will result in 9 deaths. A 75% reduction.
But while last year 3,386 cases became an estimated 35 deaths, this year we can use age-specific-CFRs to estimate they will result in 9 deaths. A 75% reduction.
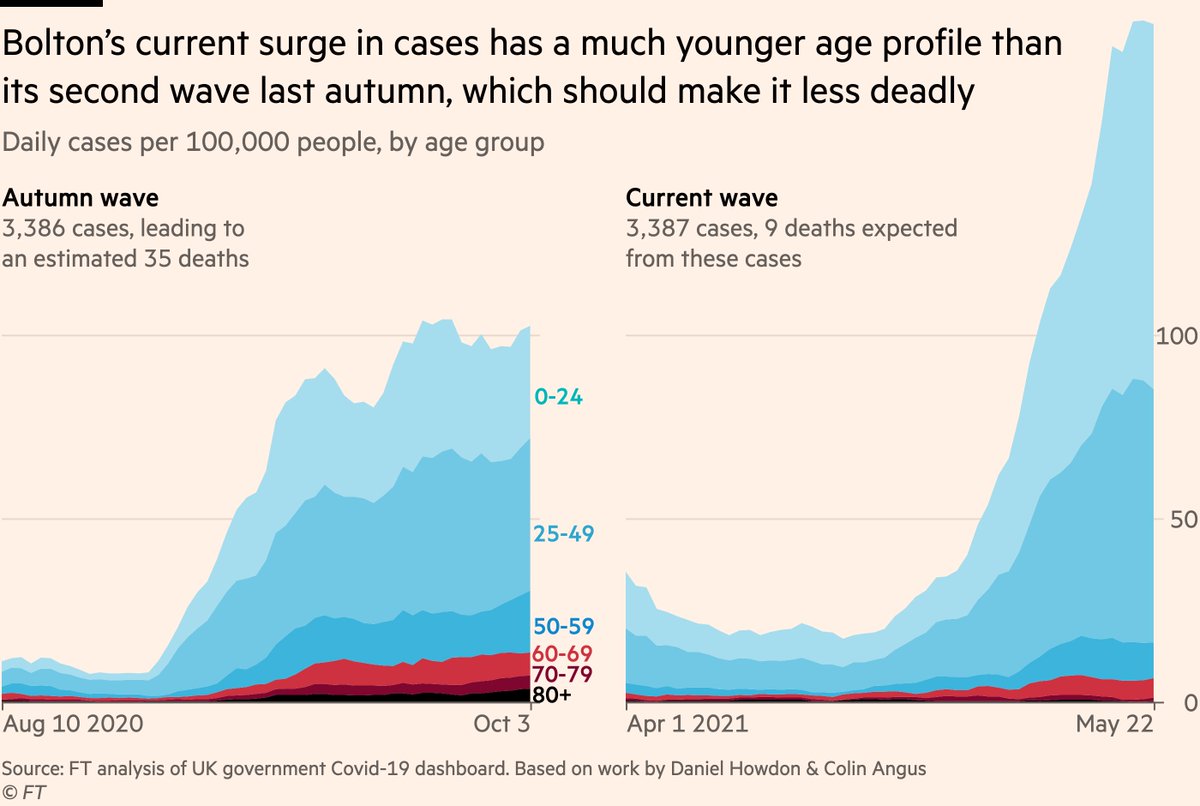
You can see the driver of that difference in expected death rate more clearly if we look only at older groups:
Although we’re looking at two periods of 3,386 cases in Bolton, the latter has far fewer cases among the elderly. 75% fewer cases among over-80s, the most vulnerable.
Although we’re looking at two periods of 3,386 cases in Bolton, the latter has far fewer cases among the elderly. 75% fewer cases among over-80s, the most vulnerable.
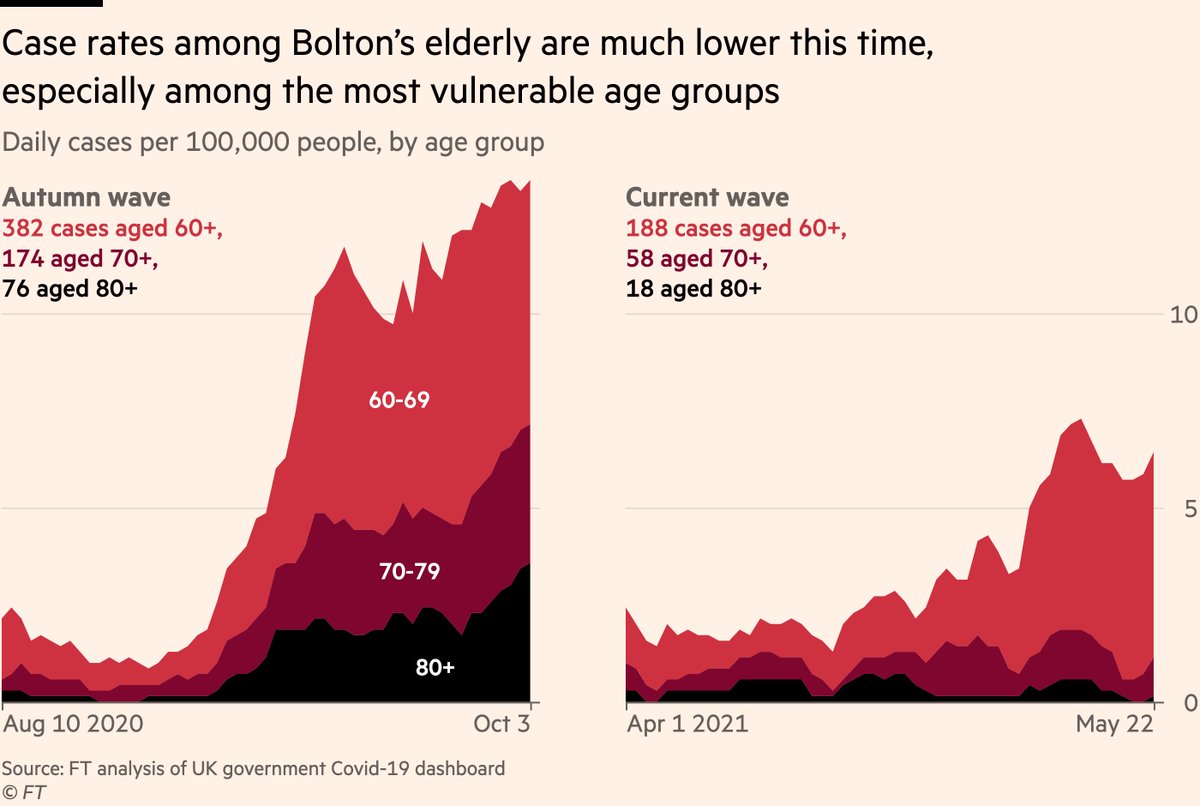
So the same number of cases but 75% fewer deaths, because vaccines are keeping [most of] the elderly out of this wave.
(A big thanks to @VictimOfMaths for giving my maths a sanity-check in those calcs, and to Daniel Howdon whose age-specific CFRs I used).
(A big thanks to @VictimOfMaths for giving my maths a sanity-check in those calcs, and to Daniel Howdon whose age-specific CFRs I used).
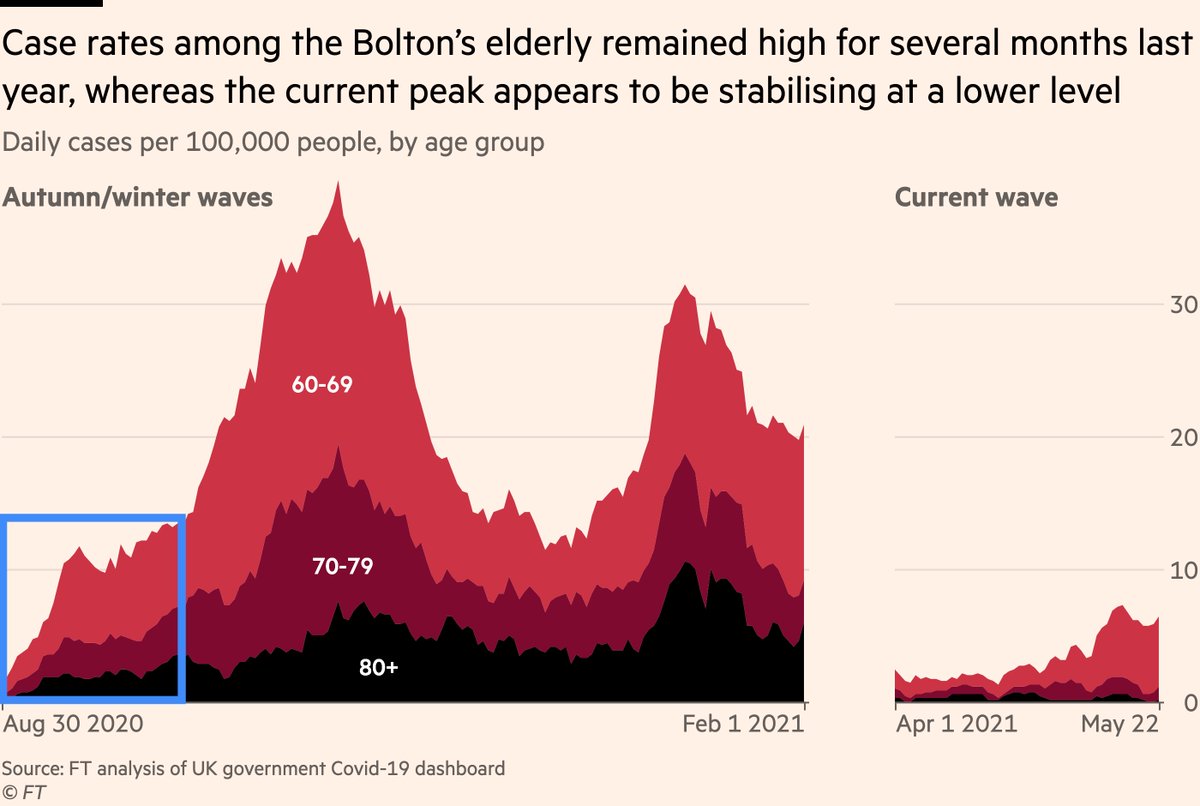
And it’s also worth plotting that same data for the whole of the second and third waves last year for Bolton:
The signs are that Bolton’s current outbreak is near its peak, whereas last year it was only just getting going.
The signs are that Bolton’s current outbreak is near its peak, whereas last year it was only just getting going.
Nonetheless, protecting the very elderly is only half of the battle.
Even though fatality rates are much lower for younger people, if large numbers of younger people get seriously ill, a small percentage of a large number can still cause lots of hospitalisations and some deaths.
Even though fatality rates are much lower for younger people, if large numbers of younger people get seriously ill, a small percentage of a large number can still cause lots of hospitalisations and some deaths.
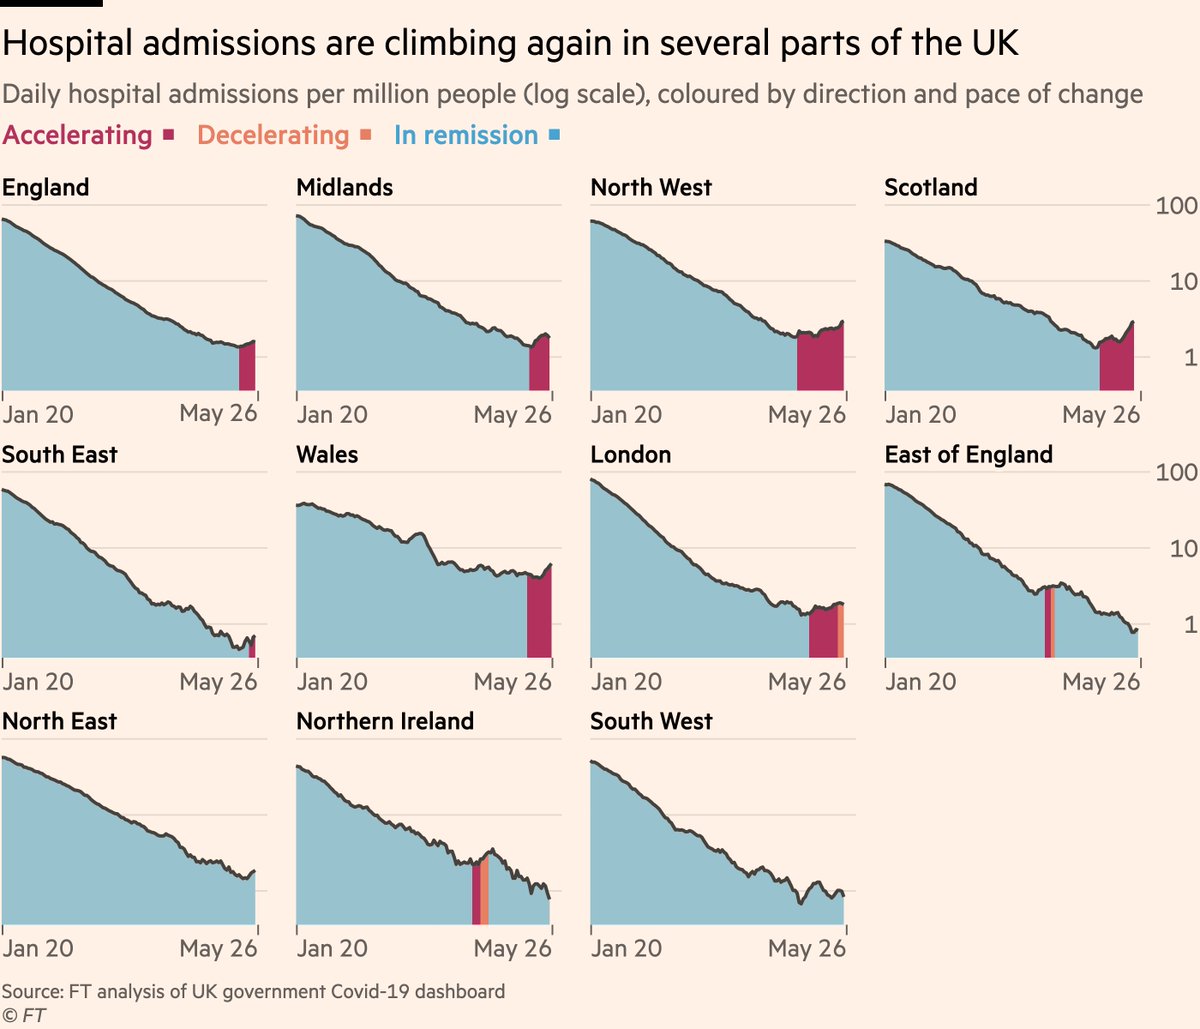
And the data now show that hospital admissions in the UK are indeed rising. Admissions have risen by 20 per cent across the UK as a whole in the last week.
In the North West that’s 25%, and in some other regions including Scotland it’s higher still.
In the North West that’s 25%, and in some other regions including Scotland it’s higher still.
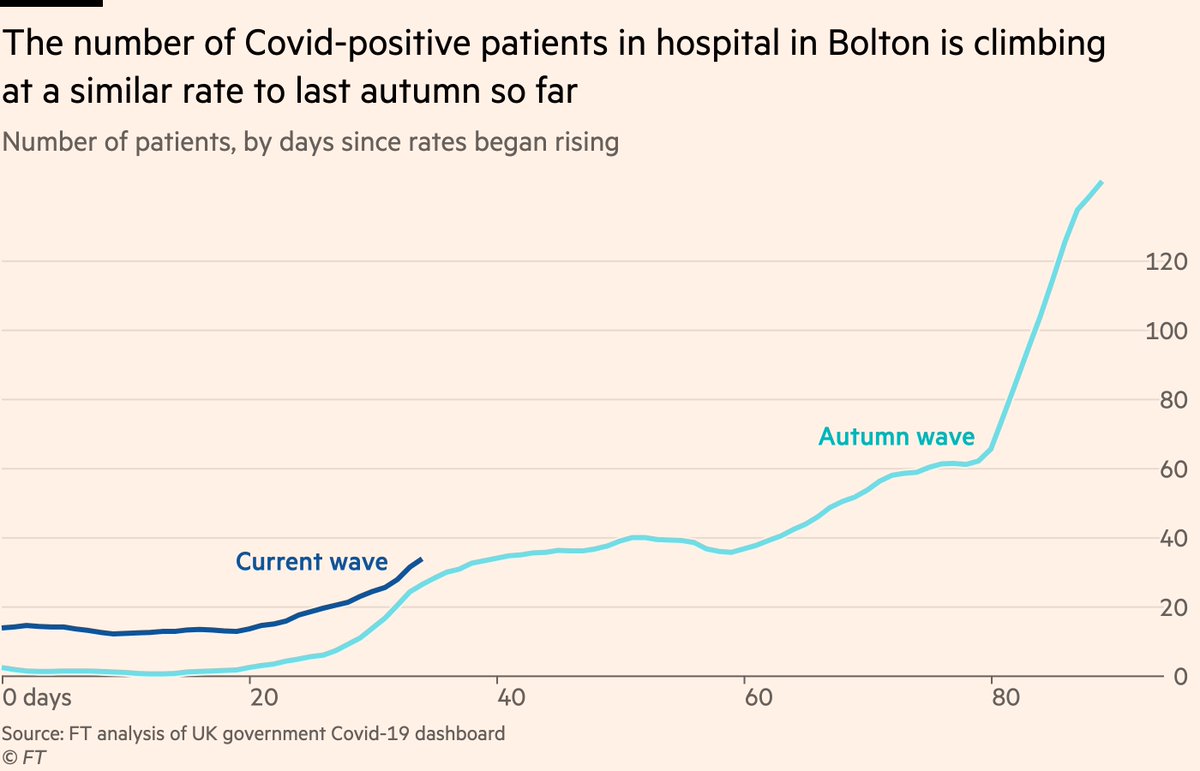
If we zoom in to Bolton, we can compare the recent rise in Covid hospital patients to the second wave.
That early rise looks very similar, though I would caution that last year rates kept climbing for months, this time with cases now no longer increasing that’s very unlikely.
That early rise looks very similar, though I would caution that last year rates kept climbing for months, this time with cases now no longer increasing that’s very unlikely.
But as with cases, it’s not enough just to look at total trends, age breakdowns matter with hospital admissions too.
And again here we see signs that this wave is not like previous waves. Thus far the rise in admissions in the North West has come exclusively among younger people
And again here we see signs that this wave is not like previous waves. Thus far the rise in admissions in the North West has come exclusively among younger people
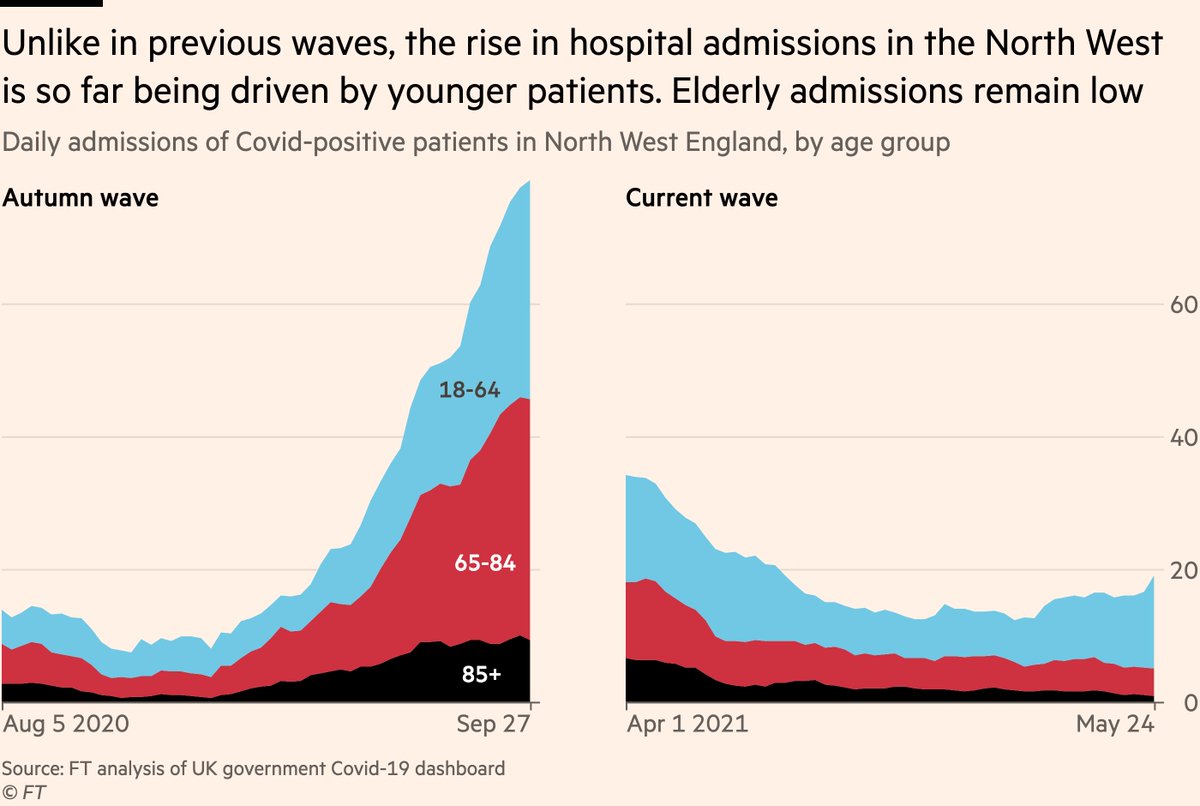
Of course, no hospital admission is a good hospital admission, and if hospitals become too full, quality of care and outcomes suffer, regardless of age.
But so far, the age profile of admissions looks promising and would again suggest a much lower fatality rate for this wave.
But so far, the age profile of admissions looks promising and would again suggest a much lower fatality rate for this wave.
So in summary:
• B.1.617.2 has sent cases rising again even in a country with very good vaccine coverage
• But vaccines are keeping cases and hospital admissions largely among the younger age groups whose risk of deaths from Covid is much lower
• B.1.617.2 has sent cases rising again even in a country with very good vaccine coverage
• But vaccines are keeping cases and hospital admissions largely among the younger age groups whose risk of deaths from Covid is much lower
To be clear, this is not a "so everything’s fine!" thread.
Everything is not fine, and with hospital admissions rising again it’s clear the reopening roadmap needs to be re-evaluated.
But this wave is not like the other waves, and it’s important to keep that in mind.
Everything is not fine, and with hospital admissions rising again it’s clear the reopening roadmap needs to be re-evaluated.
But this wave is not like the other waves, and it’s important to keep that in mind.
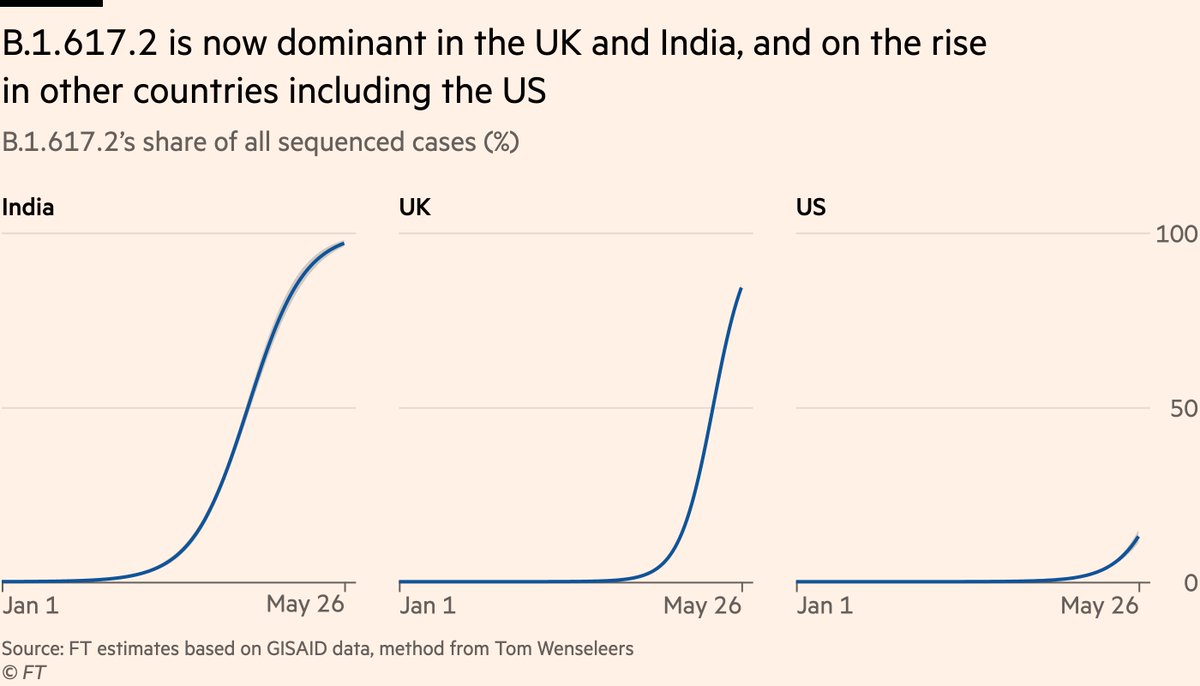
Finally, I said other countries will soon face this challenge.
B.1.617.2 is already dominant in India & UK (and many other Asian countries where sequence data is lacking), but prevalence also climbing fast in US, as well as many European countries.
(HT @TWenseleers for method)
B.1.617.2 is already dominant in India & UK (and many other Asian countries where sequence data is lacking), but prevalence also climbing fast in US, as well as many European countries.
(HT @TWenseleers for method)
What we’re seeing in UK is very likely to show up in other Western countries soon. This thread is a sign of what may come, but also a call to vaccinate, fast.
Vaccines are already making UK’s third wave less lethal. With enough jabs in arms, next country could fare even better.
Vaccines are already making UK’s third wave less lethal. With enough jabs in arms, next country could fare even better.
• • •
Missing some Tweet in this thread? You can try to
force a refresh