Council of Economic Advisers Profile picture
May 28, 2021 11 tweets 3 min read Read on X
Personal income fell by 13% in April, a smaller fall than market expectations, as fewer economic impact payments went out than in March (which saw a large increase in personal income) 1/
Aggregate compensation (reflecting both number of employees and wages/benefits paid) again grew at 0.9 percent month-over-month, a strong pace. It rose further above its pre-pandemic high from last February. 2/
Nominal spending on goods decreased slightly, driven by nondurable goods, while spending on services continued to increase. The increased spending on services and decreased spending on goods likely reflects a reopening economy. 3/
Unemployment insurance payments fell in April as workers continued to come off of the program. 4/
Year-over-year, headline PCE inflation increased by 3.6%. Adjusting for base effects from depressed pandemic prices last spring, it increased by 2.4%. This index hit its pandemic nadir in April 2020. 5/
Core inflation, which removes volatile food and energy to make it easier to track the trend, rose by 3.1% year-over-year. Adjusted for base effects, it rose by 2.2%. About 60 percent of the acceleration was due to base effects. 6/
The rise in core inflation was driven by an increase in the price of durable goods, which rose by 1.4% month-over-month, up from 0.6% the month before. 7/
The price of nondurable goods rose by 0.3%, down from 0.8% the month before, and services held steady at 0.5% month-over-month. 8/
The fastest price rise in durable goods was price gains in motor vehicles and parts. 9/
Prices in pandemic-affected services (e.g. airfare) rose by 8% in April. Prices in those services remain 8% below their pre-pandemic level. 10/
Overall, this report is consistent with a strengthening labor market and an economy restarting from a pandemic. /end

• • •

Missing some Tweet in this thread? You can try to force a refresh
 

Keep Current with Council of Economic Advisers

Council of Economic Advisers Profile picture

Stay in touch and get notified when new unrolls are available from this author!

Read all threads

This Thread may be Removed Anytime!

PDF

Twitter may remove this content at anytime! Save it as PDF for later use!

Try unrolling a thread yourself!

how to unroll video
  1. Follow @ThreadReaderApp to mention us!

  2. From a Twitter thread mention us with a keyword "unroll"
@threadreaderapp unroll

Practice here first or read more on our help page!

More from @WhiteHouseCEA

Sep 10
Today the Census Bureau released its estimates of income, poverty and health insurance for 2023, which showed that the strong economy and key Biden-Harris Administration policies helped fuel real income gains, especially for those at the lower end of the income distribution. 1/
Real median household (HH) income had a strong year, up by $3,070 (4%). A gain of this magnitude has occurred only 3 other times in this series, which begins in 1967. Further, median income reached an all-time high for Black HHs. /2
Relative to 2020, median HH incomes rose in real terms for all, Black, Hispanic, White non-Hispanic, and Asian HHs by between $700 (Hispanic) and $2,650 (Black) or 1% to 4.9%. /3 Image
Read 11 tweets
Jul 25
Real GDP grew by 2.8% in the second quarter, above expectations for 2.0%. Over the last four quarters, GDP grew by 3.1%.  In Q2, growth was fueled by another quarter of strong consumption growth, as well as business investment. 1/ Image
Real private domestic final purchases (PDFP), which removes net exports, inventory investment, and government spending, is estimated to have grown by 2.6%, consistent with the strong growth rates seen since 2023Q1. 2/ Image
Over the past year, real GDP grew 3.1%. This is considerably faster than what private forecasters anticipated a year ago, when the Blue Chip consensus forecasted 0.4% real GDP growth over this period. 3/ Image
Read 12 tweets
Jul 5
Today’s employment report shows the U.S. economy added 206,000 jobs in June, just above expectations. Prior months’ estimates were revised down by 111,000 on net. Through May, the average three-month gain in payrolls was a healthy 177,000. 1/ Image
Employment gains were widespread across industries, but were led by private education & health services, state & local government, and construction. The diffusion index, which measures the share of private sector industries with growing jobs, increased to 59.6%. 2/
The unemployment rate ticked up to 4.1% and the labor force participation (LFPR) rate ticked up to 62.6%, suggesting that increased labor force participation partly led to the increase in the unemployment rate in in June. 3/ Image
Read 13 tweets
Jul 3
Marking the 60th anniversary of the 1964 Civil Rights Act, a new CEA Issue Brief summarizes research on the continued prevalence of discrimination by race in a variety of economic domains & presents new analysis on racial discrimination and racial bias. 1/
whitehouse.gov/cea/written-ma…
The Civil Rights Act of 1964 outlawed segregation in public places, outlawed employer discrimination on the basis of race, color, religion, sex, and national origin, and created the Equal Employment Opportunity Commission to enforce the law's provisions. 2/
While the U.S. has made progress in many domains since the 1960s, CEA details evidence of present-day differential treatment by race in access to housing, employment, and business loans—even in settings where there are no relevant differences across groups other than race. 3/
Read 10 tweets
May 3
Today’s employment report shows the U.S. economy added 175,000 jobs in April, a bit below expectations. Revisions to prior months’ estimates were relatively small on net. Through April, the average three-month gain in payrolls was a healthy 242,000. 1/ Image
The unemp. rate ticked up to 3.9% in April, the 27th straight month below 4%, tied for the longest period since the late 1960s. The broadest measure of underemployment, U-6—including those working part-time for economic reasons and the marginally attached—ticked up to 7.4%. 2/ Image
The unemployment rate of Black workers fell to 5.6%, reversing its rise last month. The unemployment rates for Hispanic and Asian workers ticked up to 4.8% and 2.8%, respectively, but both remain lower than their rates last at the end of last year. 3/ Image
Read 13 tweets
Apr 30
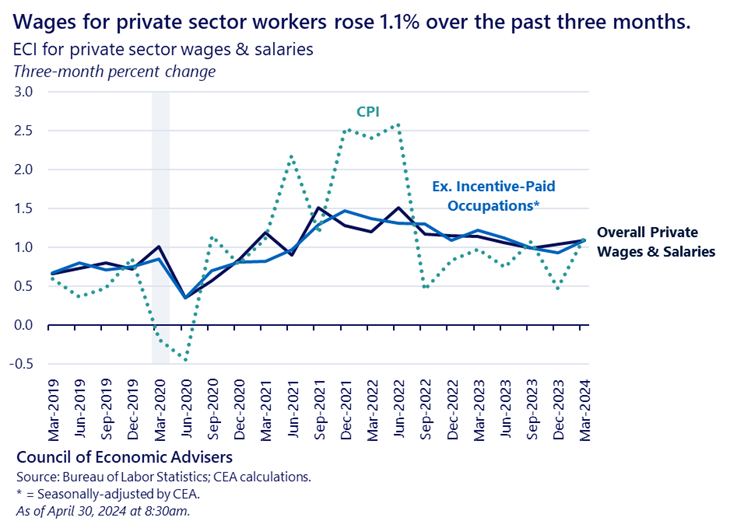
Today’s Employment Cost Index (ECI) release shows that wages for private sector workers grew 1.1% between December and March, slightly higher than the three-month growth of 1.0% through December, and somewhat elevated versus the 0.8% average in 2018 & 2019. 1/ Image
Excluding incentive-paid occupations—in which pay tends to be more volatile—private-sector wage growth was also 1.1%. 2/
Total compensation for all civilian workers (except those in the federal government) rose 1.2% in the three months ending in March, a bit higher than the 0.9% growth in the three months through December. 3/
Read 6 tweets

Did Thread Reader help you today?

Support us! We are indie developers!


This site is made by just two indie developers on a laptop doing marketing, support and development! Read more about the story.

Become a Premium Member ($3/month or $30/year) and get exclusive features!

Become Premium

Don't want to be a Premium member but still want to support us?

Make a small donation by buying us coffee ($5) or help with server cost ($10)

Donate via Paypal

Or Donate anonymously using crypto!

Ethereum

0xfe58350B80634f60Fa6Dc149a72b4DFbc17D341E copy

Bitcoin

3ATGMxNzCUFzxpMCHL5sWSt4DVtS8UqXpi copy

Thank you for your support!

Follow Us!

:(