Thread on "Reading the Tape" / Level 2 / Time and Sales
The Fintwit community often talks about trading purely off the tape, but no one really explains what that means because it varies for everyone and is tough to put into words. Hence, I thought I'd explain some key things I look for when trading off of it
I don't know where to start, so I'll just mention points that come to mind in no particular order
1. Bid shoving. A lot of FURUS will hit random tickers with a market slap and then put a huge limit on the bid side and proceed to walk it up in cents, moving up the bid price while simultaneously taking out the ask until the ticker hits scanners and attracts fomo chasers to slap
Once those fomo chasers slap, it pings even more on scanners and attracts more slaps and then when enough attention is on it, they'll yank that massive bid people think is interested in the stock or is 'bid support' and market sell on them
2. Bid/Ask Flashing. Sometimes you'll see a huge bid or ask that shows up on lvl 2 that is put to frighten the other side into giving up on their long/short, and right before it tests the price, they'll yank it
They often do this when they don't want the price to rip that way or someone needs to accumulate. They do this because trader psychology would tell you not to add if you see a big size or sell out of fear. So long as you don't see the ask constantly moving down, it's a good sign
3. Hidden buyers/sellers. Certain people (MMs) can hide their buy/sells on the level 2, but it'll show on the time and sales. If you see a stock stuck at a price, not moving but the order flow is showing big buys or sells, someone is accumulating before the big move either way
An example I recall is that $NAKD during the WSB run wouldn't rip past (if I recall) 0.7500. The ticker was stagnant at that price, to the decimal, for 10-30 seconds at a time. The level 2 ask was paper thin, yet it was stuck there
What you could have seen though was IMMENSE selling and buying on the time and sales. This is an example of a whale getting out / one accumulating before the stock rips. After that, It proceeded to go berserk
4. General. When I'm scalping, I don't even care about the chart (aside from my technical patterns) - I'm primarily watching level 2. If I'm long and see huge bids getting whacked, I know to cut because the selling pressure is too strong and will likely cause the price to tumble
On the contrary, if I see huge asks getting smashed and showing on the time and sales, it signals the bulls are winning and to hold
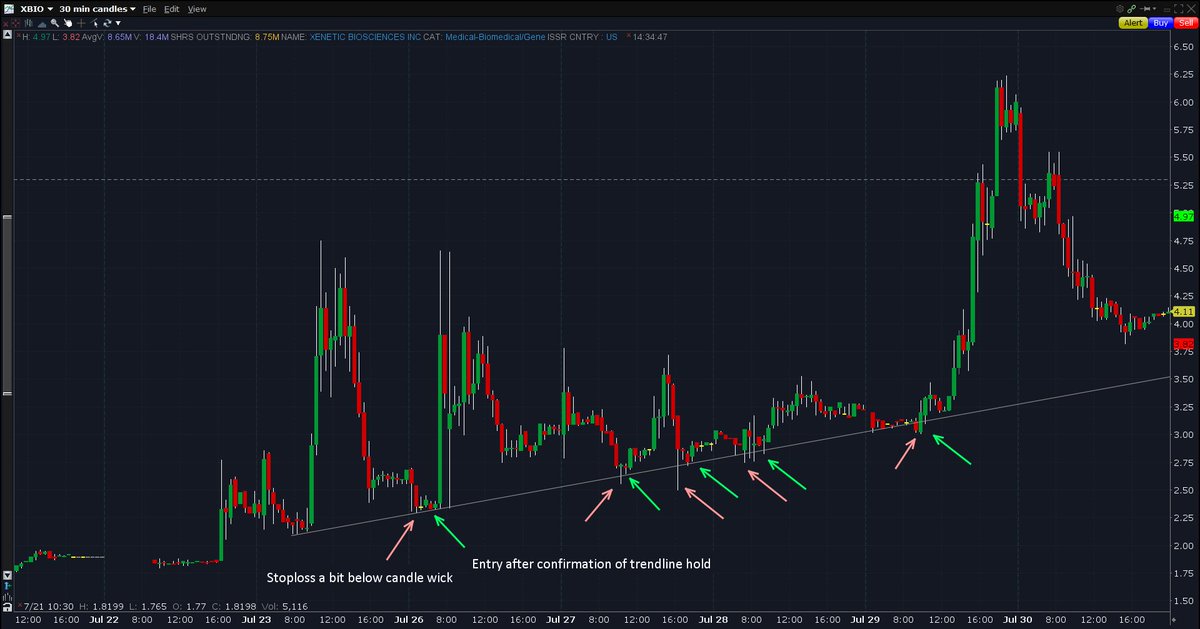
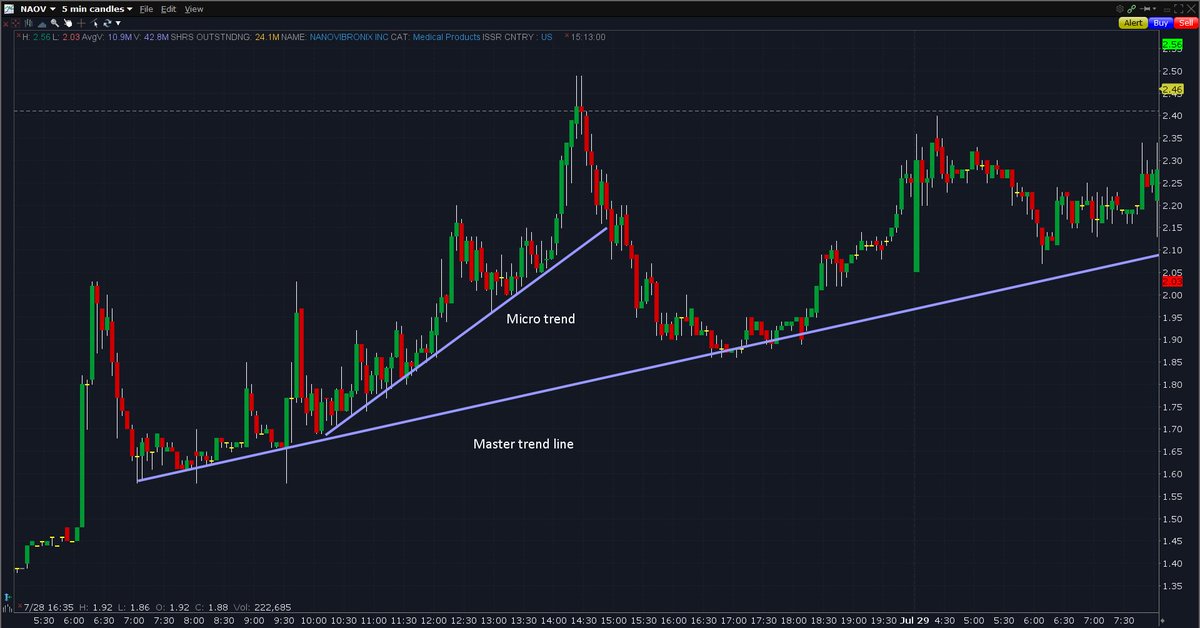
5. Knife bounce plays. If I'm playing a bounce scalp, before I watch the tape, I'm watching to see if the body of the candle is swallowing the wick or not. When I see the wick, I shift to level 2 and check if the bids are moving up and asks are getting eaten
This, tied in with my own support levels, signals my scalp. I would not advise knife catching though. It is very risky and can sometimes continue knifing. This is just personally how I, if I do, play them.
6. Stacking / walking down. If I see a big ask move down the ladder and more immediate stacking occurs on that price, I get the signal someone is shorting the stock very heavily and become more cautious with the time and sales to see if it flashes or is getting chipped away
if I see it flash, I'm bullish. Conversely, If I don't see it breaking in large increments, it signals to me that buying is weak and the bears are winning. Similar logic vice versa: if bears see a big bid moving up and not flash or get chipped heavy, they'll start covering
There's probably more stuff, but tough to recall right now. I'll add to the thread later if something crosses my mind. Nonetheless, reading the tape is the most important art in the world of trading. Price action will tell you the move BEFORE the move happens.
You'll struggle with this when you start because there are a million different things going on in plays, but with time, you can get good at it. It's the 10,000 hours rule.
Learn. Read. Execute.
Learn. Read. Execute.
Also, one thing to make note of is that some brokerages don't show full depth of data. Webull, for example, only shows Nasdaq bid/asks. It doesn't show Arca, NYSE, etc. Hence, you may buy into a massive wall without even realizing it because you literally can't see it on level 2
Video I did with Brady.
• • •
Missing some Tweet in this thread? You can try to
force a refresh