$BTC Liquidity 📚
I often use the term "Liquidity" in my analysis'.
I'll explain how it works and how I use it personally.
1/11
I often use the term "Liquidity" in my analysis'.
I'll explain how it works and how I use it personally.
1/11
So what does "Liquidity" mean?
While all three definitions are obviously correct, the bottom one is most relevant for us.
2/11
While all three definitions are obviously correct, the bottom one is most relevant for us.
2/11

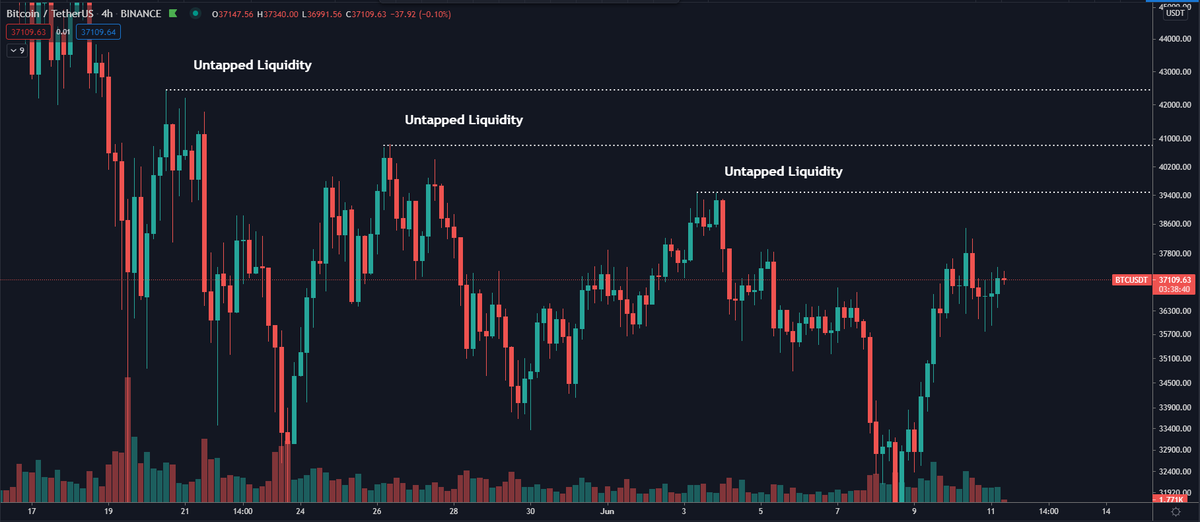
The levels I map out are often important pivots (reversal area's) with highs that haven't been touched in a while.
This means that there is most likely a lot of stop losses placed there. Because these are the most clear invalidation levels for most people.
3/11
This means that there is most likely a lot of stop losses placed there. Because these are the most clear invalidation levels for most people.
3/11
In this case, price kept making lower highs so these highs are untouched.
We can likely conclude that above these highs, shorts have placed a lot of their stop losses.
That means that going ABOVE this level triggers these SL's and causes a lot of buying volume.
4/11
We can likely conclude that above these highs, shorts have placed a lot of their stop losses.
That means that going ABOVE this level triggers these SL's and causes a lot of buying volume.
4/11

🔹Why would we go to those levels?
This is because price often seems to search for liquidity.
If you would want to fill a lot of orders (into the hundreds of millions), it's easier to push price up into these area's where a lot of liquidity will be. Vice versa for longs.
5/11
This is because price often seems to search for liquidity.
If you would want to fill a lot of orders (into the hundreds of millions), it's easier to push price up into these area's where a lot of liquidity will be. Vice versa for longs.
5/11
If you'd for example push price up above these highs, you'd then see buying volume coming in from:
1. Short stops/liquidations being triggered.
2. Breakout traders buying the break of the previous lower high.
6/11
1. Short stops/liquidations being triggered.
2. Breakout traders buying the break of the previous lower high.
6/11
After that, either one of two things happen:
1. If the volume is very high, we often see a big short squeeze happening which can extend quite high and makes for a nice pump.
These short squeezes can cause a snowball-effect which makes price go higher at every break.
7/11
1. If the volume is very high, we often see a big short squeeze happening which can extend quite high and makes for a nice pump.
These short squeezes can cause a snowball-effect which makes price go higher at every break.
7/11

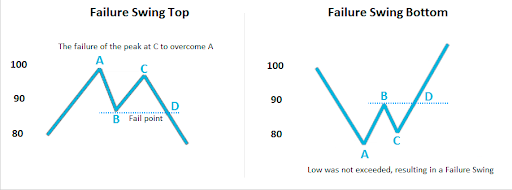
2. If the volume for continuation isn't there. Or price was deliberately pushed into these levels just to sell into the buying volume. We often see these highs taken out only to then reverse afterwards and end up in more downside.
We also call this a Swing Failure Pattern.
8/11
We also call this a Swing Failure Pattern.
8/11

Whatever happens is very situational. For example when breaking the previous cycle's all time high at $20K. Price saw a huge short squeeze and never came back to even retest the level to this date. This was due to the huge amount of buying pressure on breaking that level.
9/11
9/11

Of course all of this can also happen in the opposite way.
Untouched lows? There's likely a lot of liquidity in terms of long position stop losses placed beneath there.
Expect selling pressure to come in whenever price clears that level.
10/11
Untouched lows? There's likely a lot of liquidity in terms of long position stop losses placed beneath there.
Expect selling pressure to come in whenever price clears that level.
10/11
I hope this cleared it all up a bit and gives you a good idea of how I work with these levels.
I think it gives you a good way to look at things from another perspective. Not seeing these levels as just as "A resistance or support". It's often a lot more than that.
11/11
I think it gives you a good way to look at things from another perspective. Not seeing these levels as just as "A resistance or support". It's often a lot more than that.
11/11
• • •
Missing some Tweet in this thread? You can try to
force a refresh