1. Today we were evaluating the accuracy of our forecasts of the routes taken by the Geldingadalur lava flows.
A THREAD ON TEACHING GEOGRAPHY *WITH* GIS
2. Yesterday, pupils had been using ArcGIS Scene Viewer to read the topography of the land to try to forecast & justify possible routes.
Reference made to
• thalweg
• how lava can rewrite the underlying topography to effectively flow up hil and overcome topographical barriers
3. We then compared our predictions with what has actually happened and discovered three categories of evaluation.
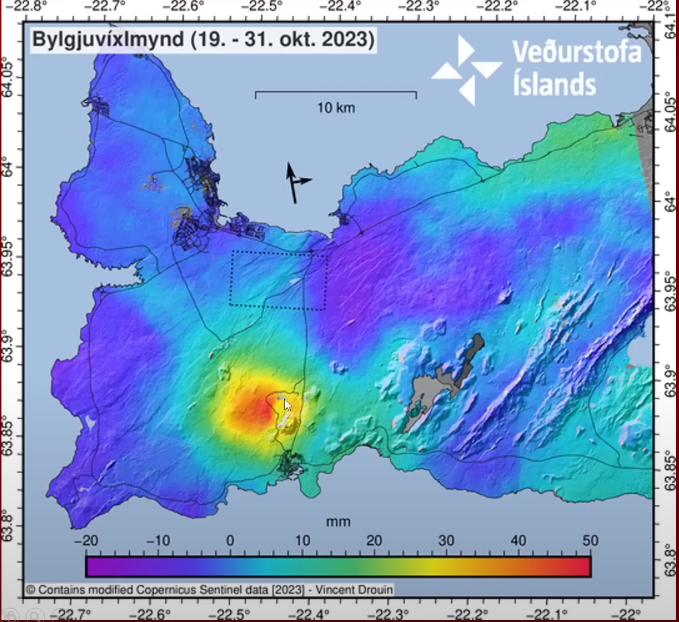
A surprise flow further to the west had happened. Currently it is feeding into the Nattahagi valley. But could it go elsewhere...?
4. We needed to be careful to re-evaluate places at risk from the - including ascertaining if there is a possible route towards the town of Grindavik, especially if the lava overtops a small ridge and flows into the valley to the west.
5. Some pupils predicted that it might flow more to the south, using the Elevation Profile tool to read the topography and find the thalweg route to the sea.
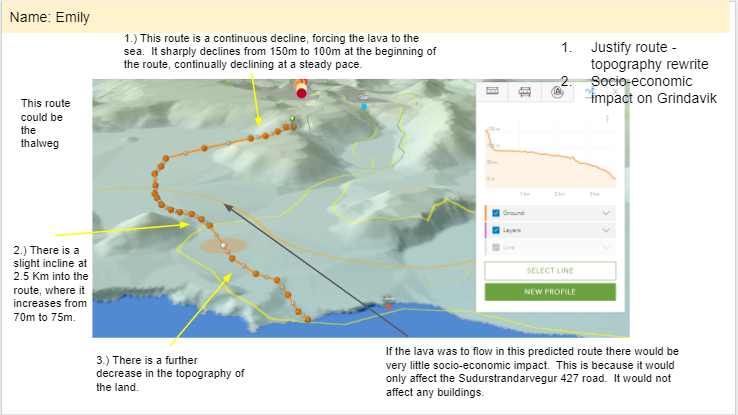
6. Some, however, saw topographical routes further west, potentially threatening the town of Grindavik.
7. Next up, we will examine, evaluate and choose management options.
• Hard engineering - can you control a lava flow? What are the options? How effective are they?
• Soft engineering - should we adopt a 'managed retreat' style approach with Grindavik?
The drama unfolds...
8. Using Scene Viewer unleashing powerful, generative learning with my pupils. They take the theoretical knowledge we've been building up & apply it in an evaluative manner.
Great geographical skills & understanding being developed.
• • •
Missing some Tweet in this thread? You can try to
force a refresh
1/ Using @sentinel_hub EO browser to collect satellite secondary data to explore this week's eruption in Iceland.
This can be a teach from the front lesson or whole class task.
2/ First, open EO Browser (create an account if you don't already have one - the password is remembered by your Chrome account future sign ins).
Search for Iceland and zoom into the Reykjanes Peninsula.
3/ Next, you have to load a satellite image to the base map - in three simple steps:
• Tap search
• Tap on the map
• Tap on the satellite image & it will appear
1/ Possible (likely?) immanent eruption in the Reykjanes Peninsula, Iceland.
Evidence has been building that another eruption is probable in Iceland, close to the previous eruptions. This thread will follow this developing story.
🧵An unfolding thread🧵
2/ First, what is the evidence over the past weeks and months?
a) Ground deformation
InSAR data reveal significant ground uplift in the region close to the Blue Lagoon, suggesting the upward movement of magma in the crust & towards the surface.
3/ This is backed up by GPS data from the region, where a trend in uplift has been observed since mid-October, consistent with the InSAR data.
(There are fluctuations in the graph from ground movement from diurnal & other temperature variations)
An unfolding thread helping us understand the nature of the devastating earthquake affecting Turkey and Syria.
🧵
1/ Size
The main shock at 4.00 am was M 7.8. This is a major quake - there are typically around 15-20 of these globally per year. But the aftershock today was 7.5, much bigger than is typical (which are normally no greater than 1 magnitude less than the main shock).
2/ Depth
The M7.8 quake was only ~ 18 km deep. This is shallow, and it means that much less of the energy released would be attenuated before reaching the surface.
The M7.5 aftershock was even shallower - only 10 km.
In the 1960s, Bruce Heezen was one of the first to connect the Mid Atlantic Ridge round South Africa to the Indian Ridge.
But he realised there was a problem: how could the Atlantic & Indian Ocean both be extending if Africa was in the middle?
2/ But he was operating with Harry Hess' convection cells model as the mechanism for moving plates: the plates are passive passengers, riding on large convection cells in the mantle. This is how Geoffrey Davies outline's Heezen's logic.
3/ Heezen, of course, was wrong: the Earth is not expanding.
So how then do we explain this arrangement of margins?
Here's a slightly wider context. Can you figure out how the plates move to accommodate this arrangement?
1/ There is a social justice dimension to this week's record breaking temperatures in GB, as outlined in this map and article by the BBC. Why does this issue exist and how can we adapt our urban environments to address it?
1/ Just started our summer term project with Y13s - a DME about the 2021 Icelandic eruption called 'Can we Stop the Lava?'
Today, it was using GIS to explore the tectonic setting of Iceland & it's relationship to volcanism 60 Ma. in NI!
An ongoing 🧵
2/ We looked at the opening of the North Atlantic over the past 60 Ma.
3/ Then we used a GIS map to explore the pattern of seafloor age. This was followed by a key question: what's the link between this process and the pattern we see?
First steps in getting the pupils to think like scientists and follow the evidence.