
Upon further review, looks like you crowned yourself the next Mr. Buffett and Berkshire Hathaway in your past THREE annual letters, @chamath. Two weeks ago we had some fun digging in to your selected disclosure methodologies, didn't we? But oh my does it get even more bizarre. 1/
I’ve now had the misfortune of reading all 3 and am stunned at the apparent need to bend, break really, the facts to make your performance shine. Let’s examine your comparison to $BRKA in your past three letters, digging yourself a hole in 2018 and burying yourself in 2020. 2/ 
Book value, skip a year, book value, stock price. That’s YOUR selected method for Berkshire as a benchmark moving target. You can’t make this stuff up. Curiouser and curiouser, to quote Alice, can be the only way to characterize the unusual presentation of your performance. 3/

Let’s begin with the 2018 letter. Your record begins with a presentation of your returns from 2011-2018 against the S&P 500. Bully to you for disclosing both a gross and NET return, at least then, as the net return was not mentioned again and went missing in subsequent years. 4/
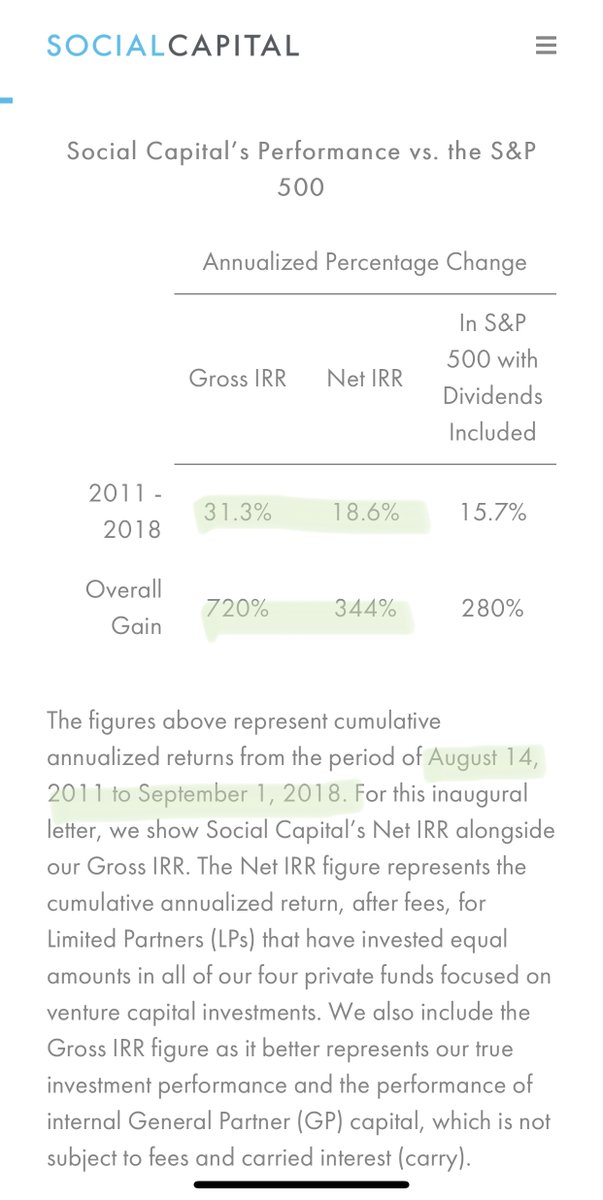
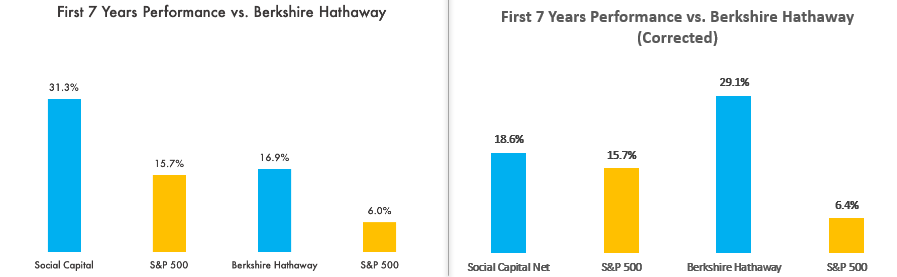
For the period 8/14/11 to 9/1/18, seven years and two weeks (we’ll get to the relevance of the dates in a bit), gross of 31.3%, congrats, nets down to 18.6%, really congrats. This appears to work out to something on the order of a 3 and 30 fee structure. Do people pay this? 5/
Good business if you can get those fees, which in the first several years of VC investing are against appraisals, not cash profit distributed or liquidity events. You end the letter, as you will do in the next two years as well, with your “long-run” comparison to Berkshire. 6/
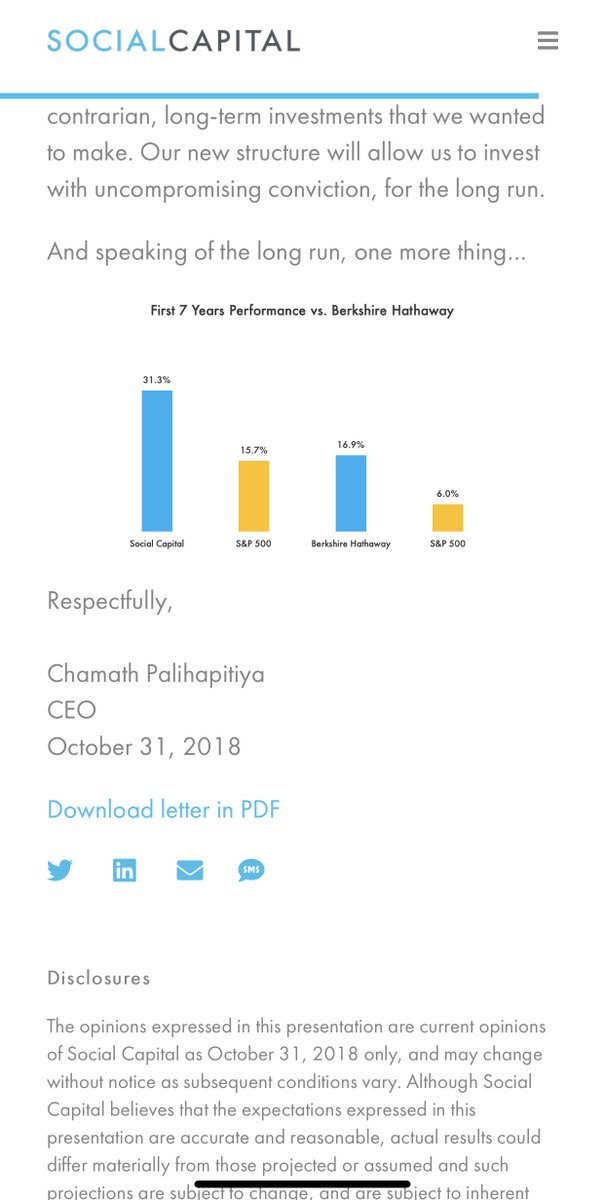
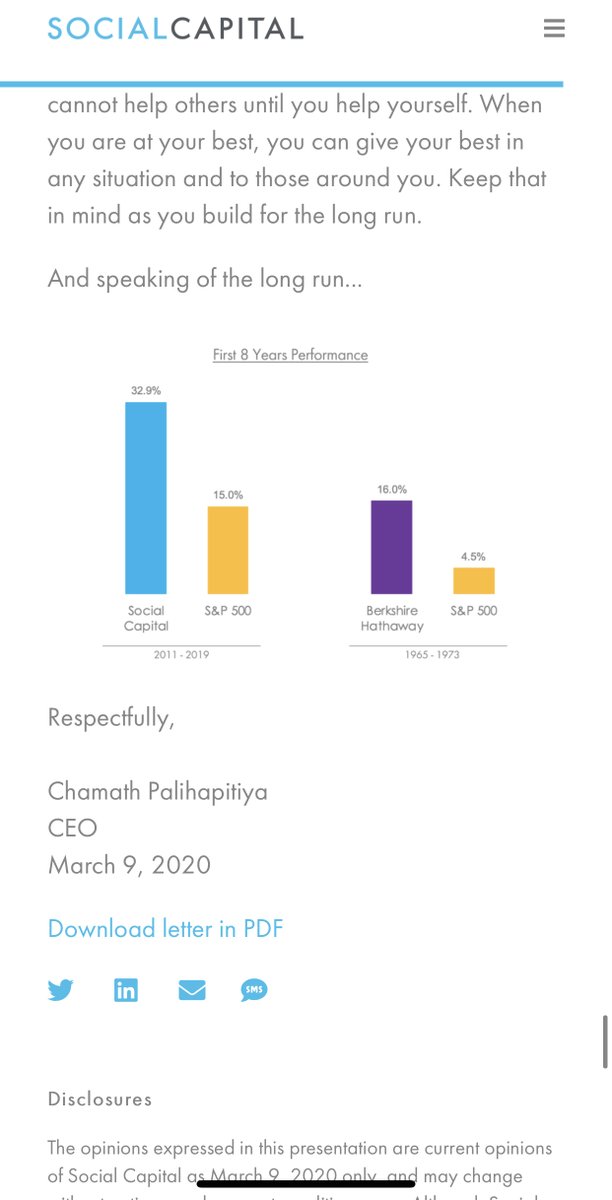
For the comparison you choose your return as gross, not the net number “earned” by your LPs, and for Berkshire you chose Berkshire’s 7-year compound change in BOOK VALUE PER SHARE from 1965 to 1971 of 16.9%. This will wind up being an interesting choice as we shall see. 7/
Seven years against seven years, check (kind of). You were two weeks longer and Berkshire actually was on a 9/30 yearend during 1965 and 1966, so ok. Red delicious versus Jonathan. The choice of using book value and 16.9% is fascinating, even ironic. 8/
Curious if you took time to calculate $BRKA's compound stock return of 29.1%, just a bit higher than 16.9%, eh? No doubt the higher figure would flatter less. To you of course. No mention of method, but had you consistently stuck with BV, you could get a pass. It gets better. 9/
In '19, the net return vanishes. The year-end shifts to 12/31. OK. Oddly zero mention, though, of using the original 8/14/11 start date anywhere in the 2019 letter. Only in reviewing your '20 letter does it seem the start date changed to an earlier date. How does that happen? 10/
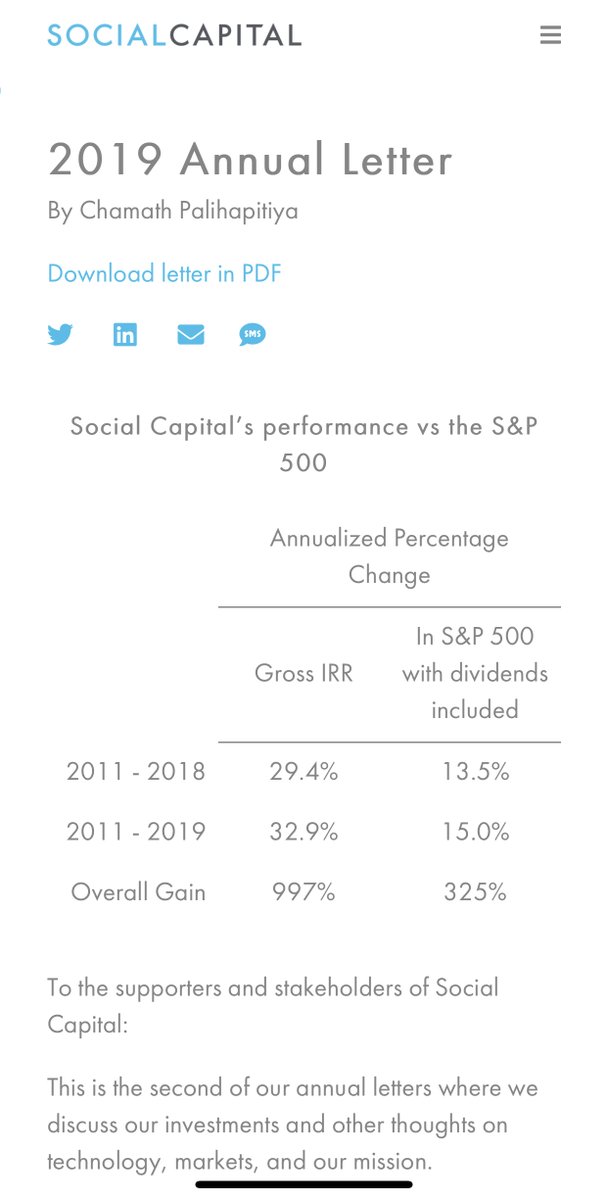
Moving dates lowered your 2011-2018 gross from 31.3% to 29.4% & the index from 15.7% to 13.5%. Stranger still, even with the table comparing your return to BRK labeled 8-year, you SKIPPED BRK's 8-year return and used their 9-year book value return of 16.0% instead. Huh? Why? 11/
Had you used stock price for BRK, the 8-year return was 26.3% and the 9-year return was 22.7%. Both higher than using book value, naturally. Why skip a year for BRK? It seems odd correctly using a 7-year at the outset, matching your original period, but then skipping a year. 12/

You didn’t have a 9-year return, even adding months, and label the table as 8-year, consistent w/ having done it correctly the prior year with the 7-year. The comparison using gross returns and the wrong period allows you to appear ahead of Berkshire again. More on this soon. 13/
The '20 letter is damning and just bad. You now CHANGE methods for presenting BRK’s performance USING THE STOCK RETURN AND NOT BOOK VALUE. No mention of the method in any letter. Perhaps you thought nobody has calculated the CAGRs by interval and would never notice? Surprise! 14/
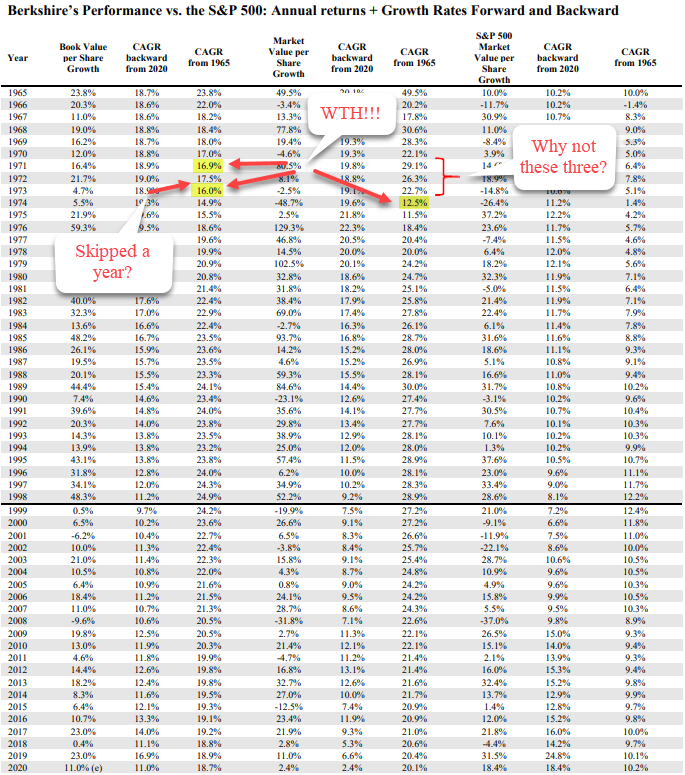
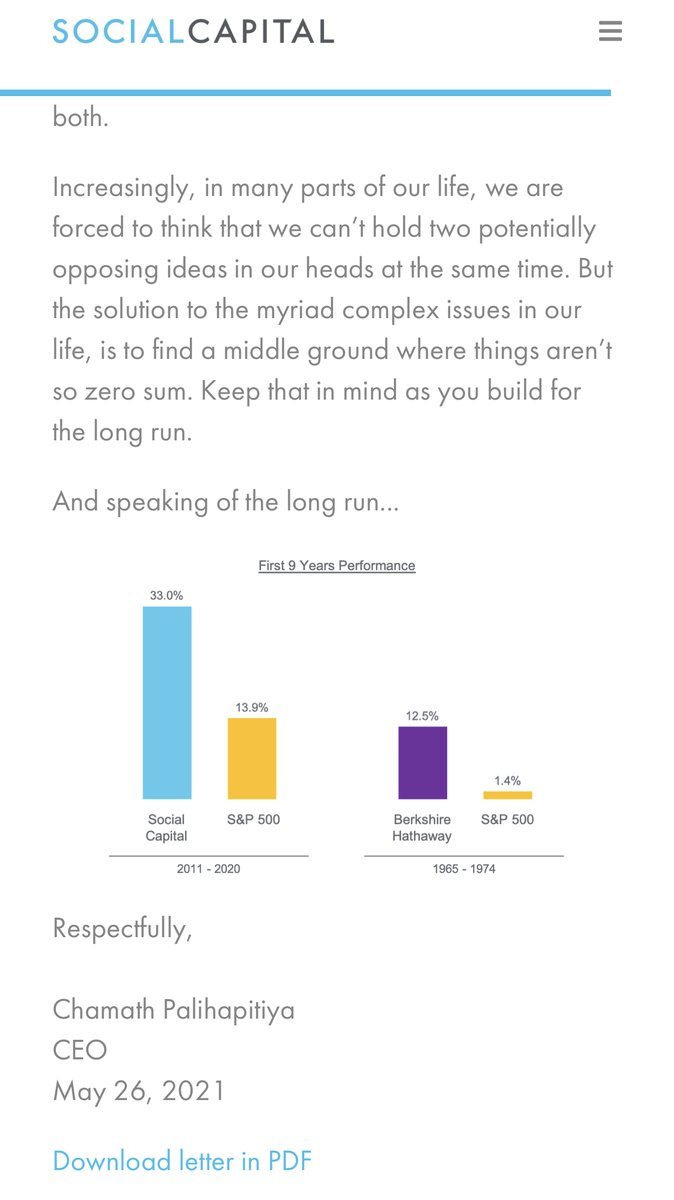
Here you use Berkshire’s 10-year return of 12.5%, with the stock having fallen 2.5% in 1973 & a whopping 48.7% in 1974. Even though you don’t have a 10-year record, you use BRK’s 10-year which includes the worst bear market since 1929-1932. Selective deceit or simple mistake? 15/
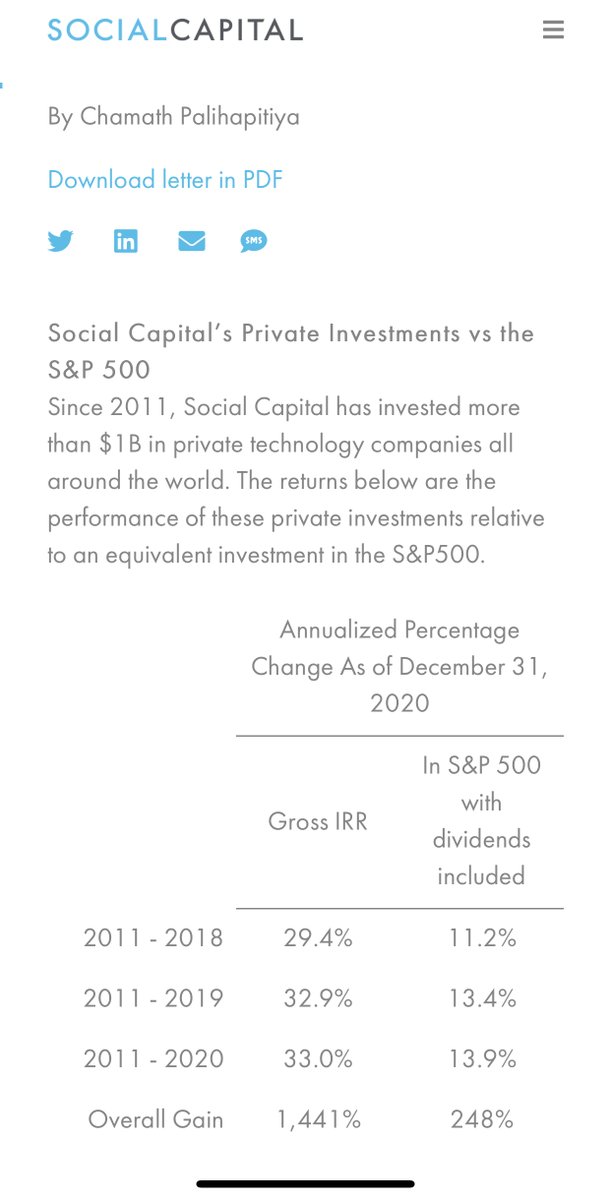
The '20 letter discloses a new start date (at least for the index) of 6/1/2011. Again, how could this change from the original 8/14/11? More unusual in that your gross retuns for 2011-2018 of 29.4% and for 2011-2019 of 32.9% were consistent from the 2019 to the 2020 letter. 16/
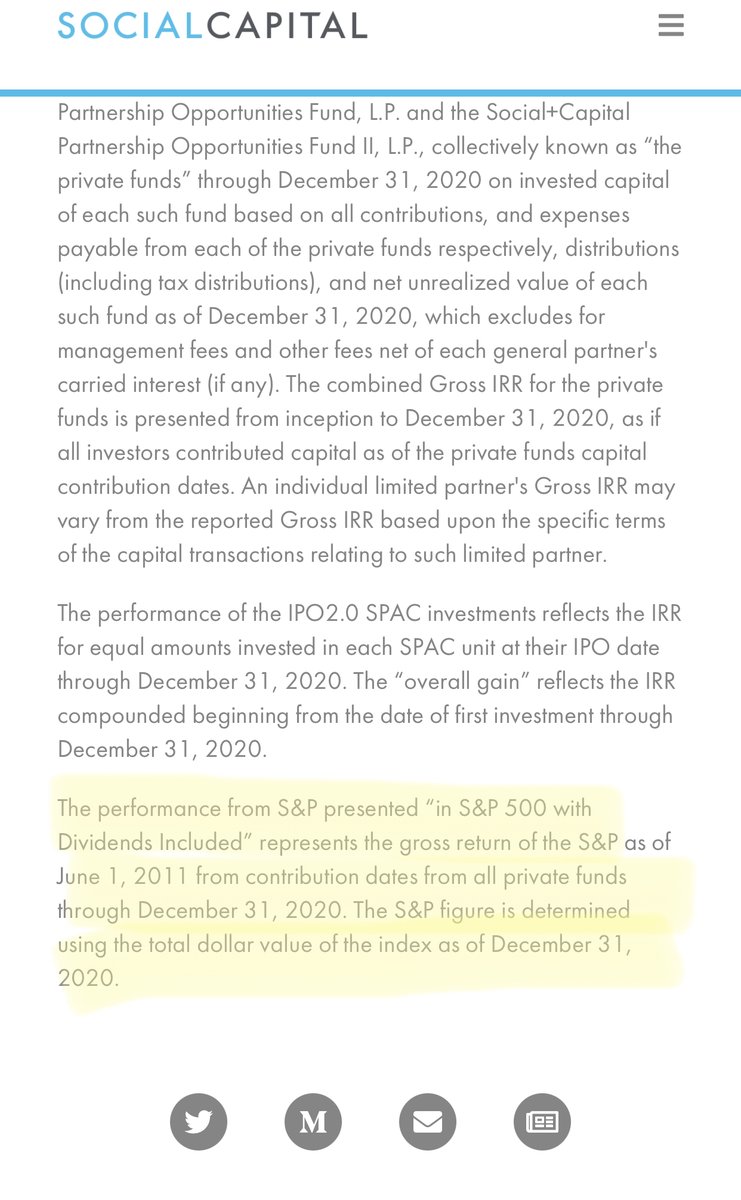
You change, however, the S&P from 13.5% to 11.2% for 2011-2018 and from 15.0% to 13.4% for the 2011-2019 interval. Same end date, yes, but did you change the start date in all 3 letters? How do YOUR returns match but the index returns change materially downward? Fantastic. 17/
With selection bias & changing the BRK “benchmark,” no consistency reporting intervals, suspended disclosure of net returns even though your fees were enough to buy all of NetJets or a small island, I thought it would be nice to help you out with corrected comparison tables. 18/
Stick with the 7 to 9-year returns for you & for BRK and I’ll use your NET returns (LPs can’t eat gross). Because you saw fit to use Berkshire’s stock market total return in 2020 (again with no disclosure of the method or the switch from book), we'll use stock return for all. 19/
Here’s the 7-year, yours pulled from your website & the corrected version on the right. Had you chosen this approach back in 2018, would you have even made the comparison to Berkshire & Mr. Buffett in the first place? By this chart you are a loser. Against Berkshire at least. 20/
Here's the corrected 8-year, using your table left & the corrected on the right. Lord knows what the time interval is for your table with no mention of the starting interval made in the '19 letter. The table shows you losing. Again. Worse still if 3% beats 2% and is 50% over. 21/
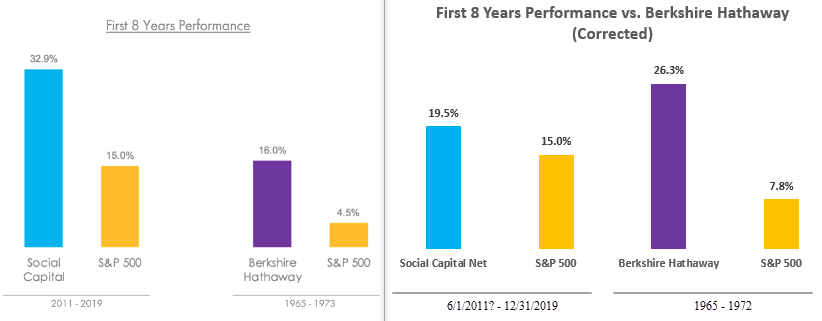
Finally, the fixed 9-year. Even w/ BRK dropping 2.5% in 1973, pulling the 9-year compound return down from 26.3% the prior year to 22.7%, you can see that that, “speaking of the long run…,” Chamath still loses. By the way, how do you always get the index returns so wrong? 22/
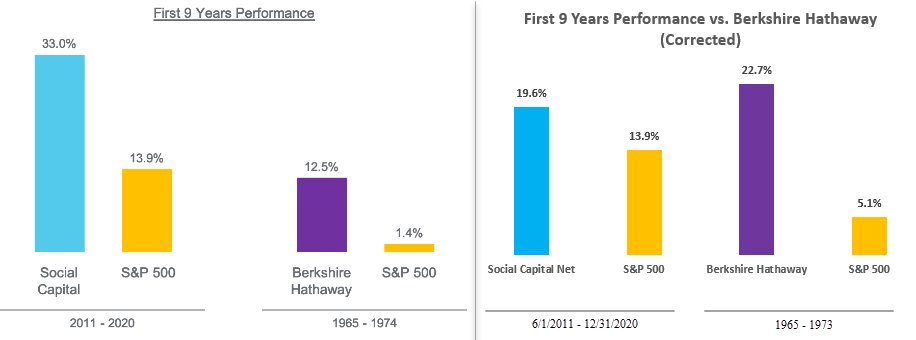
Next year, when you present your 9-year, 7-month results against Berkshire’s 10-year return, you will get to incorporate 1974's 48.9% drop in Berkshire against your net result. You will win the following year as well, because Berkshire’s stock only recovered 2.5% in 1975. 23/
Berkshire was struggling in 1975 with the textile operation and p/c insurance was in a brutally tough underwriting period. Don't let it go to your head. By your 12th year, it gets ugly for you again, with BRK’s stock up 129.3% in 1976, lifting the long run return up to 18.4%. 24/
From there, Berkshire's annual return never again falls below 20% on a compound basis, reaching 28.9% by 1998 and is still at 20.1% at year-end 2020. Guessing by then you will have dropped the comparison. Maybe by next year even? 25/
Perhaps if you compared yourself to Mr. Buffett during what were HIS first years managing HIS LPs you might look better? Sadly, you lose here as well. You can see that Mr. Buffett presented his gross AND net annual returns, and also by year, useful disclosures all. 26/
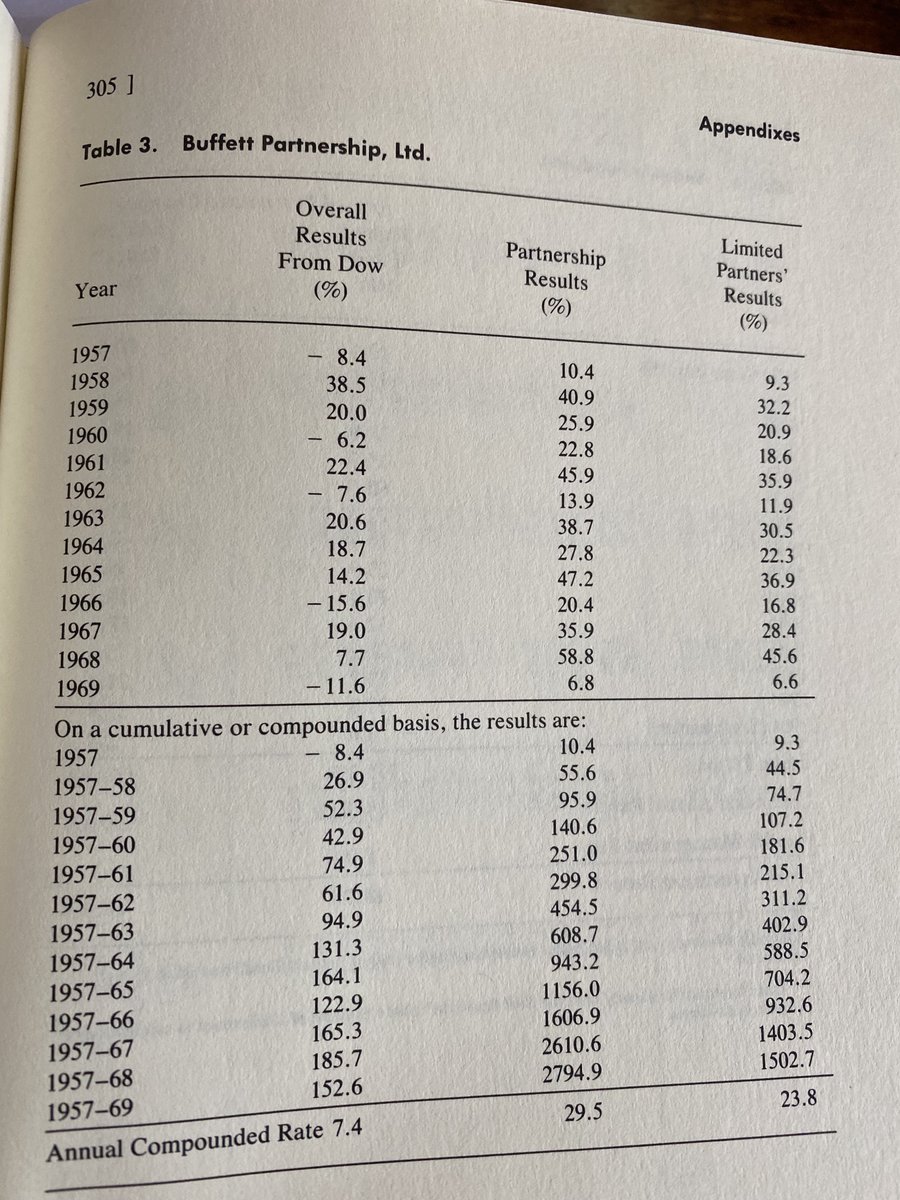
These returns for the Berkshire Partnership(s) can be found in the appendix to Ben Graham's "The Intelligent Investor." Mr. Buffett's annual partnership letters are also widely available. I assume you haven't read any of these or you wouldn't have gone down the path you did. 27/
I'd be happy to send you a copy of The Intelligent Investor. I have ~15 copies laying around & have given countless copies to young investors over the years. Mr. Buffett calls it the best investing book. If you don't want a free one here's a link: 28/
amazon.com/Intelligent-In…
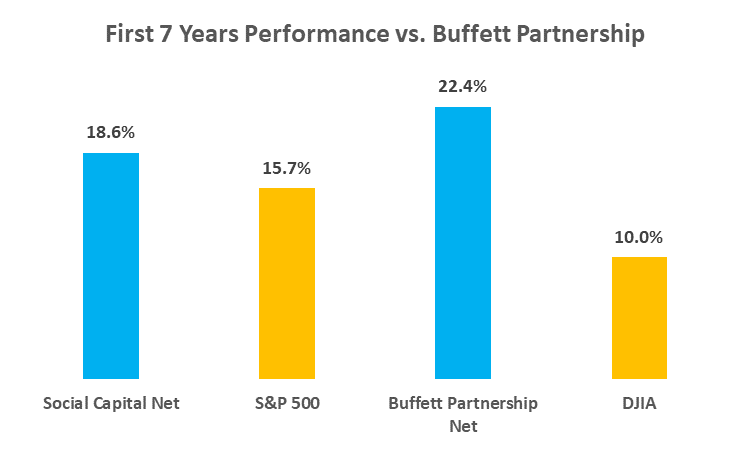
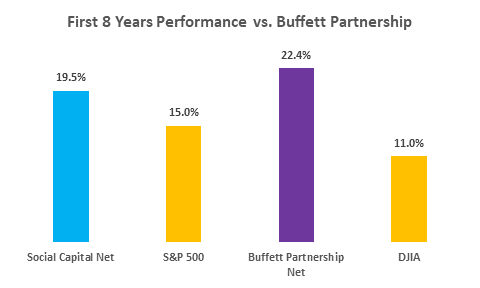
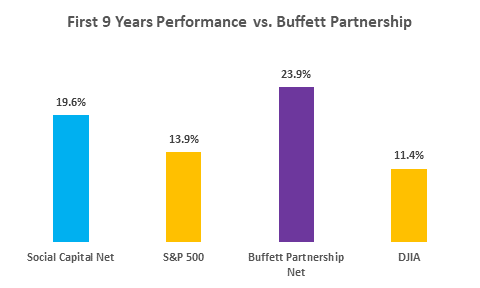
amazon.com/Intelligent-In…
Here are the comparisons for your net returns against Mr. Buffett's nets for his first 7, 8 and 9 years managing his partnerships. I used the trusty [(1 + return percentage) x (1 + return percentage)...-1] to arrive at the compound annuals. Its a handy formula you could use. 29/
Why don’t you disclose the annual returns, gross and net, for EACH of your 5 partnerships? Not sure why they end? Some interesting media stories seem to convey that things weren’t going so well at Social Capital by 2018, the year of your first letter. 30/
newyorker.com/magazine/2021/…
newyorker.com/magazine/2021/…
It appears many/most of your partners/staff jumped ship & were even winding things down. No doubt some fund investments had liquidity events with Slack, Box and Wealthfront IPO'ing. But what has become of the rest of the investments and partnerships? 31/
axios.com/social-capital…
axios.com/social-capital…
It’s one thing to charge giant performance fees on appraisals in the early years of VC. Not a VC’er, but understand liquidity events are often targeted for years 7 to 10. It looks like the LPs were dropped from the record before 2019? Any subsequent performance, even if poor? 32/
Perhaps not be the case, but if distributions evolved or funds were closed, I'd think current and prospective investors would like to know the outcome for each partnership. Wouldn't it be very easy to include the return record for each fund in the disclosure to your letters? 33/
Creating a “composite” and linking funds of differing sizes and start dates on an IRR basis allows one or two home runs to mask weak or poor results elsewhere. I believe guys like @MohnishPabrai disclose returns for EACH partnership and do so on an annual basis. Seems right. 34/
@MohnishPabrai Might it make sense for you to use the format Mr. Buffett used when disclosing performance for his partnership(s)? Gross, net, by year and compound? No quibble with using IRR and not TWR for VC funds as long as you disclose returns and dollar size for each unit separately. 35/
@MohnishPabrai Feel free to use the corrected/correct tables if you restate your letters. Perhaps you have a compliance person, internal audit or general counsel there that can help? Maybe outside auditors or counsel? There are some great performance verifiers and audit firms for hire. 36/
@MohnishPabrai I’m quite sure that seeing yet more SEC S-1 registrations for yet more SPACs that any prospective investor would like to see a more properly (at least conservatively) prepared comparison against Berkshire Hathaway since you insist on making that ill-suited comparison. 37/
@MohnishPabrai Lastly, I’d think with your being an officer of public companies and still raising new capital from the public, many of whom are retail investors, that the good folks at SEC enforcement might take an interest in your annual letters, methods and disclosures, or lack thereof.
• • •
Missing some Tweet in this thread? You can try to
force a refresh


