The BBB Series – Topic 3: Yield Curve
Inspired by @EffMktHype, I will be laying down the basics of the yield curve. We often hear people talk about the curve, especially when it is inverted. But why is it important? What does a normal curve look like? What drives its shape?
Inspired by @EffMktHype, I will be laying down the basics of the yield curve. We often hear people talk about the curve, especially when it is inverted. But why is it important? What does a normal curve look like? What drives its shape?
Simple, a yield curve is a line showing the yields of bonds of different maturities. The bonds used to construct the yield curve have the similar credit equality (e.g., BBB curve) or come from the same issuer (e.g., US Treasury).
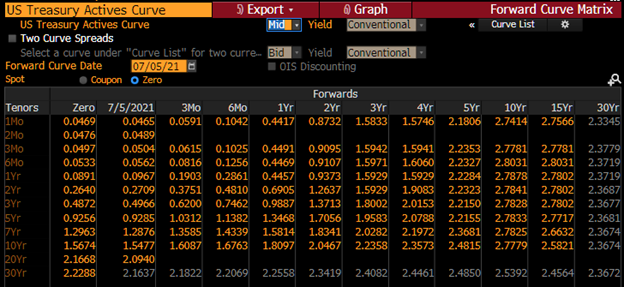
In Bloomberg, you can load the US treasury curve with GT10 Govt GC <GO>. Typically, a yield curve is upward sloping. It can also be flat, inverted, or twisted (rare). We typically divide the yield curve by three major buckets: front-end (0-3y), belly (3-7y), and long-end (7y+). 

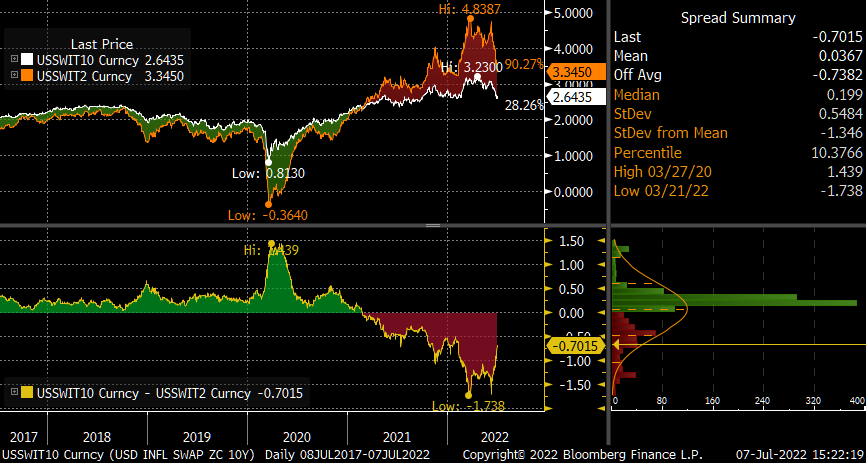
The yield of a longer-term bond (e.g., 5y) reflects short-term spot and forward yields (1y, 1y1y, 2y1y, 3y1y, 4y1y) and thus the (market) expectations for the short-term interest rate path. Currently, interest rates are expected to increase over time. FWCM <GO>
As maturity increases, interest rate (duration/vol) risk increases as well. To compensate for the increasing risk, investors earn a risk premium (higher yields) by holding longer-term bonds.
OTOH, increasing positive convexity (noncallable/make-whole), better investors demand for longer bonds (10y, 20y, 30y) lower the long-term bond yields. That is why a yield curve is typically steeper in the front and flatter in the back.
If you are long bonds, positive convexity means you make more when interest rate decline by a certain amount (e.g., 20bps) than you would lose when rate goes up by the same amount. And you want to own convexity if you expect rate volatility to exceed market expectations.
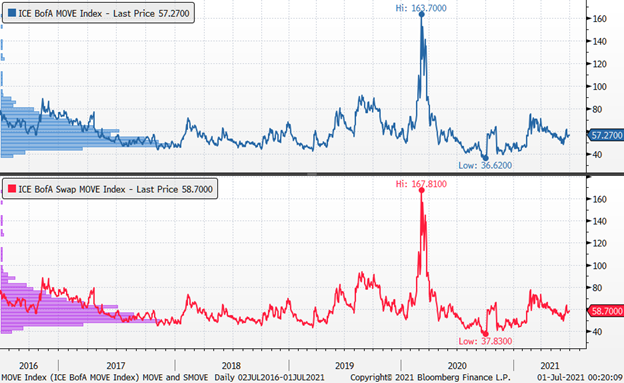
To quickly gauge the market expectations for volatility, you can look at MOVE or SMOVE index, which is the curve-weighted *normalized* 1M implied volatility.
You can also enter <VCUB <GO> to look at the ATM normalized implied volatility of the interest rate swaptions of different expiry (vertical) for different bond tenors (horizontal). As you can see, as bond maturity increases (left to right), volatility increases.
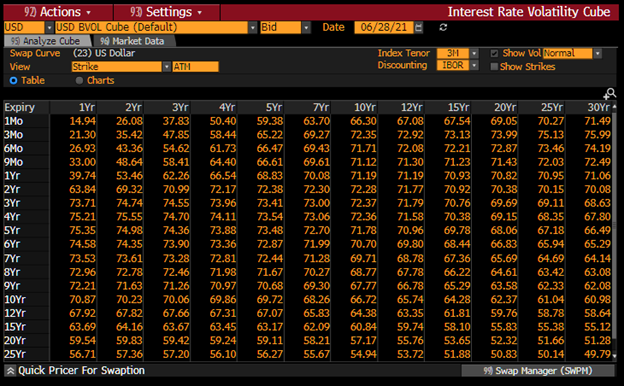
And as the option maturity (up to down) increases, volatility increases up to a point before market expectations for mean-reversion kicks in.

OK. The yield curve is typically upward-sloping, so what? Well, investors love to look at the yield curve to understand (and sometimes predict) economic cycles.
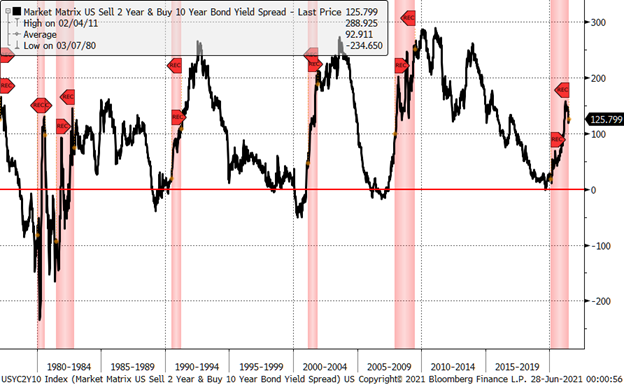
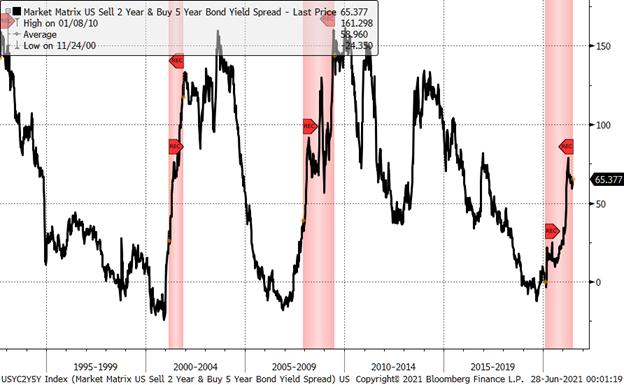
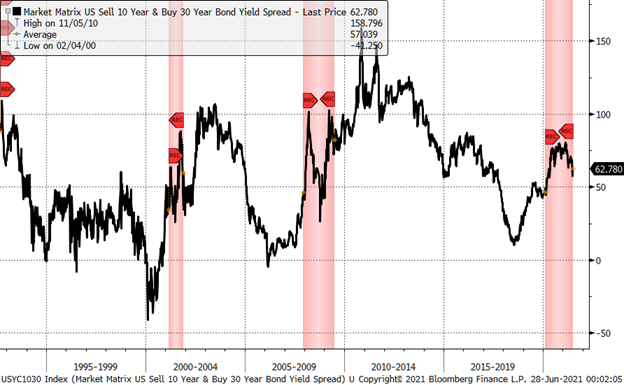
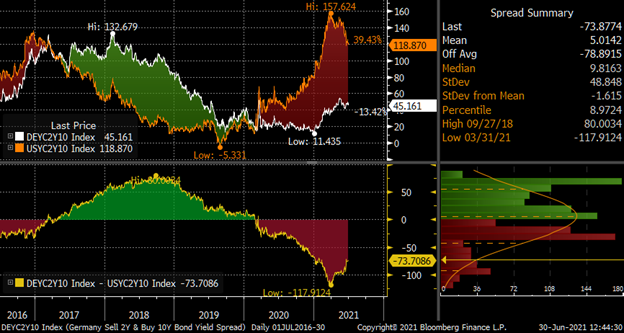
They typically look at different term spreads, for example, between 10y and 2y bonds (2s10s, BBG: USYC2Y10 Index), to look at economic cycles. You can see the reason why an inverted curve gets so much attention as inversion typically happened before a recession in the past.
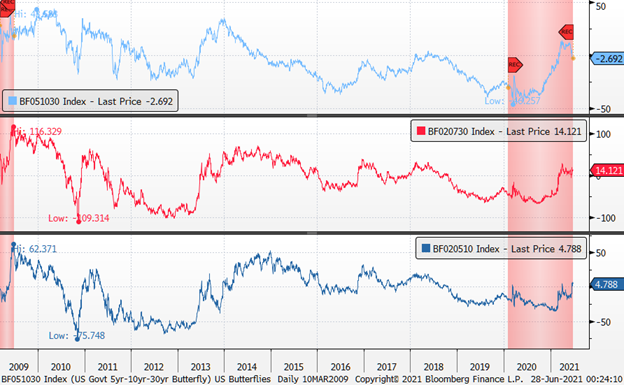
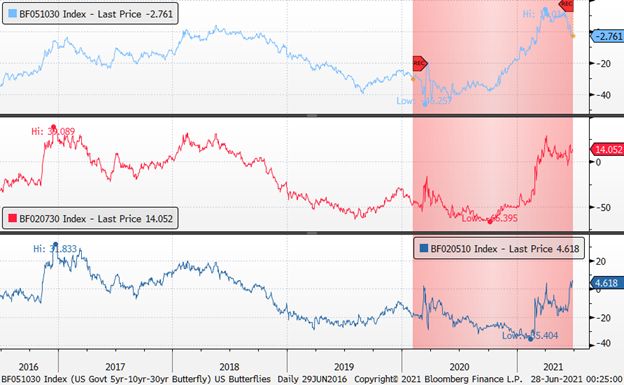
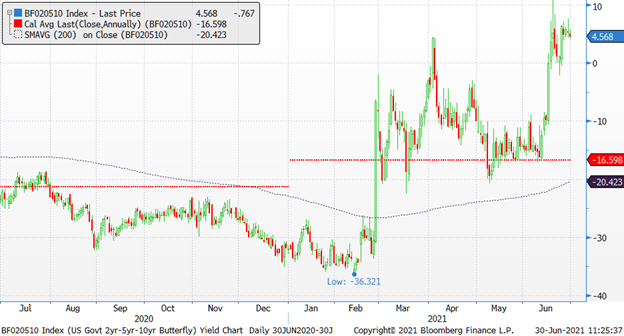
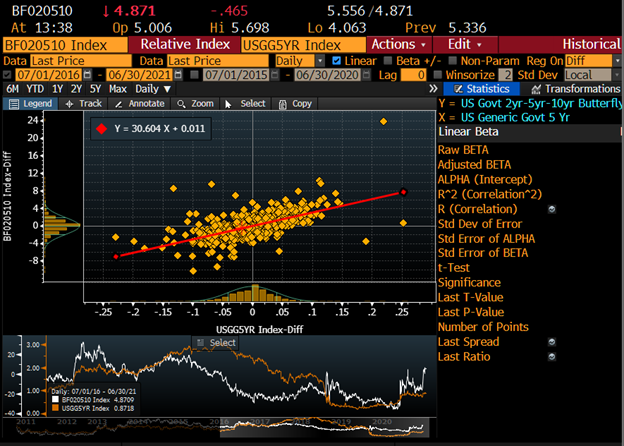
Investors also evaluate the evolution of the yield curve by looking at the butterflies, which comprises of three maturities/tenors. For example, a 2y5y10y fly (BBG: BF020510 Index) is the yield spread of 5y (x2) – 2y – 10y.
In this case, the 5y is the body, and 2y and 10y are the wings. The chart below shows 3 different butterflies. When the butterfly spread goes up, the body underperform the wings.
So, what does the shape of yield curve mean for your bond investment? When the yield curve is steep, long bonds are very attractive because of the carry and rolldown. Carry is simply the income return of your long bonds over cash or short-term securities (T-Bills).
When the yield curve is steep, the financing or opportunity cost (LIBOR + spread, repo, T-Bills) is lower than the yields of longer bonds, and you can earn excess returns by “carrying” the longer bonds.
However, when we talk about carry in practice, we look at it as a breakeven measure in yield term. It tells us how much yield can go up before we lose money on a financed bond position over our holding period, e.g., a year.
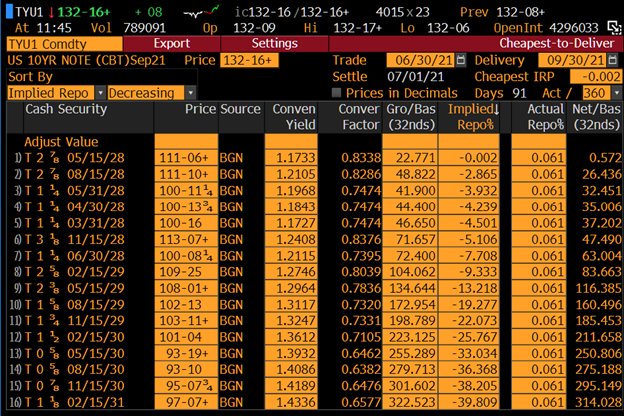
In this example, your 1Y carry is 21.7bps. This carry in yield term is the difference between the forward (1Y4Y) and settlement rates (“Yield Drop” in FPA <GO>), derived with arbitrage-free assumption.
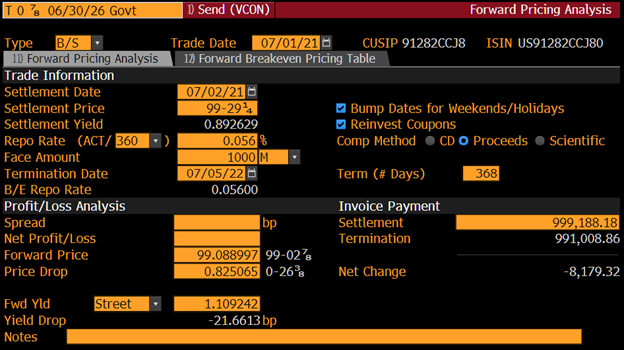
The forward rate is your breakeven yield, assuming no shift in curves, and over the next year, the yield on your bond has to exceed the breakeven level (1.109%) in order for you to lose money.

Rolldown is your return as your long bonds get shorter on an upward sloping yield curve. Here, a 5y bond yielding 0.893% will become a 4y bond in a year, and if the yield curve stays the same in a year, you can sell your bond at 0.682% (higher price) with a rolldown of 21.1bps.
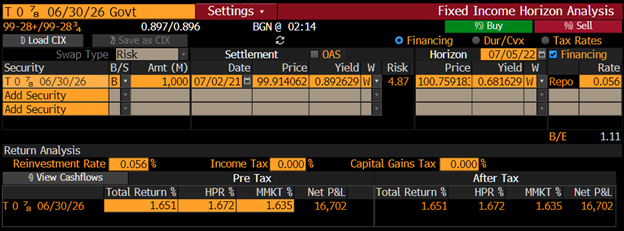
You are “rolling down” the curve as you sell the shorter bond at a higher price and reinvest the proceeds in a longer bond at a lower price. You can also think of rolldown as the rise in yields over the holding period that would eliminate the rolldown effect.
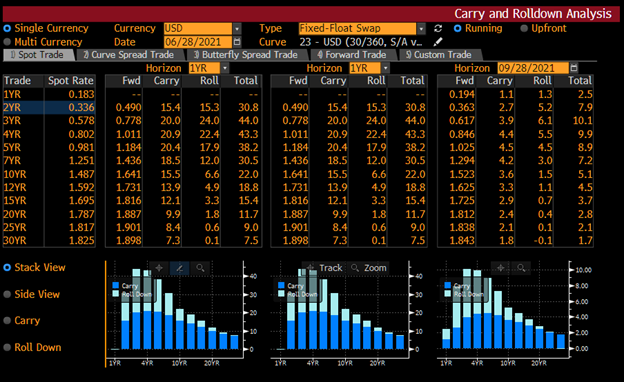
So, carry & rolldown are powerful. Where can we easily see them? We can use CARY <GO> to look at the swap curves. Typically, the levels and shapes are not meaningfully different from the govt curves, with differences (swap spreads) driven by demand for hedging, credit risks, etc.
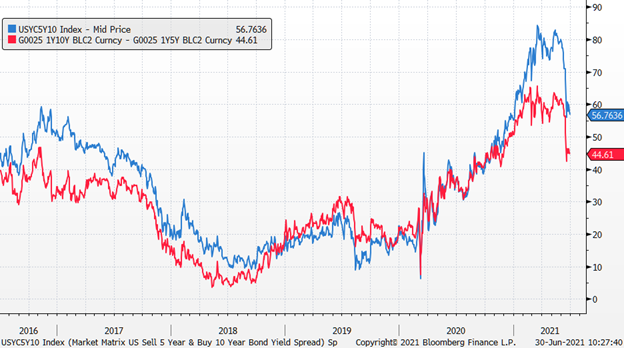
So how do we trade the yield curve? Say if you think the 5s10s curve (56bps) is still too steep and expect it to flatten more than the forwards (44bps). How do you structure the trade?
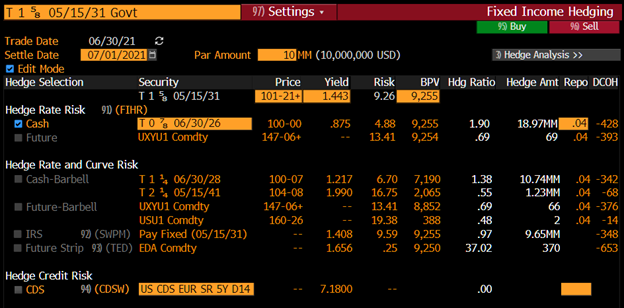
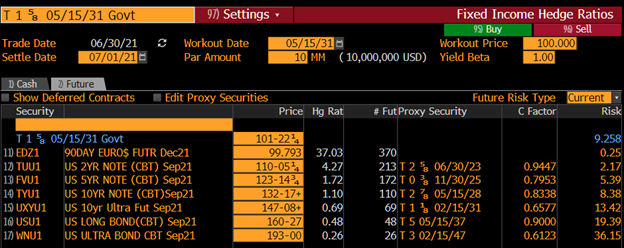
You can be buying the 10 year and selling 5 year, either with cash bonds or futures. And typically, we want to take out the interest rate risk (DV01/duration neutral), and there is an easy BBG function for this (FIHG <GO>).
Here, say you want to buy 10MM Par of the OTR 10y, to hedge the duration, you will borrow and sell short about 18.97MM Par of the OTR 5y. Your spread DV01 (BPV) is about $9,255. Or you can sell 5y futures (FV) instead.
In practice, I prefer using futures for short positions if there is no dislocation in basis (DLV <GO>) making futures unusually cheap compared to cash. The disadvantage is that you need to keep rolling your futures to maintain a position. We also consider capital efficiency.
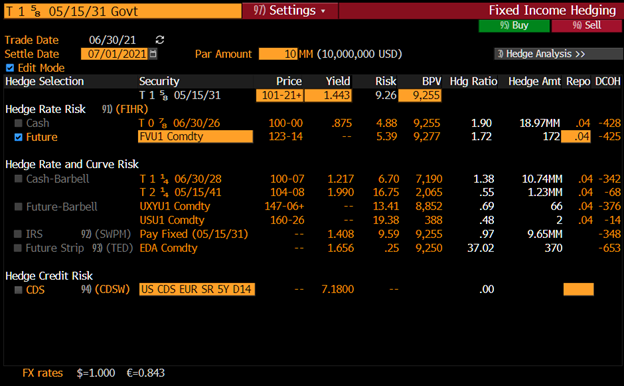
Here is long cash 10y and short 5y (FV futures) – the BPV does not match perfectly ($22/bps), you can match the futures DV01 by entering (9,277) in the BPV field, and it will show you the exact par amount for the cash 10y.
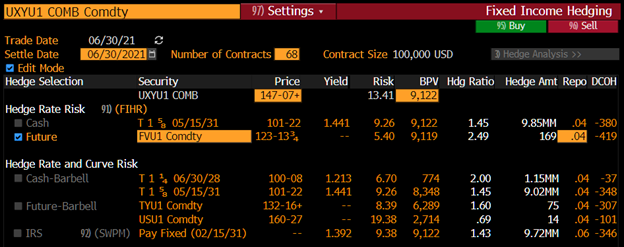
Here, we are trading the curve with futures only. I use the ultra 10y UXY futures instead of 10y TY futures because it better expresses my view (5s10s) instead of (5s7s). The CTD bond of UXY is a 2031 bond (10y). The CTD bond for TY is a 2028 bond (7y)
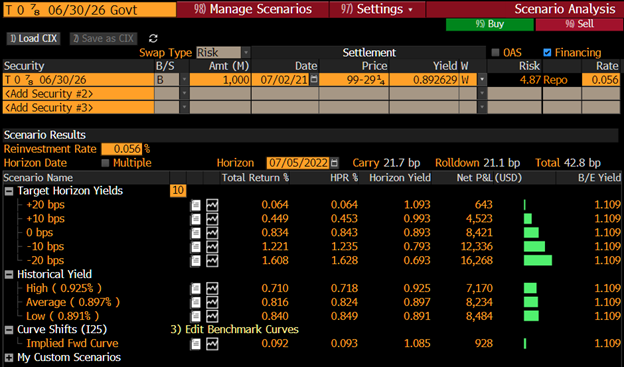
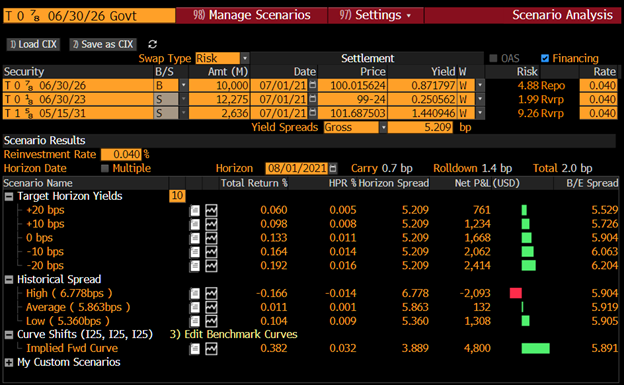
What happens now that you have initiated your trade, what would your PnL looks like? Let’s take a look at it. In FISA, we look at what happens in 3M, 6M and 12M. In the FISA chart, “Target Horizon Yields” assume a parallel shift in the yield curve.
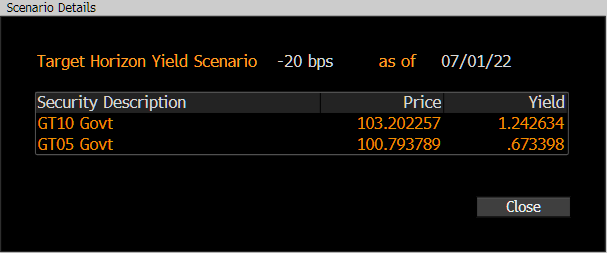
For example, in the -20bps scenario, it assumes your 10y and 5y bond yields decline by 20bps. The High/Average/Low “Historical Spreads” are calculated over the past year.
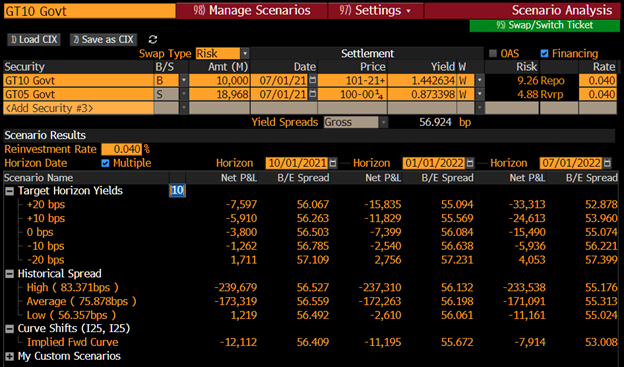
This is how your PnL look like if you put on a flattener over the next 3, 6, and 12M. Especially interesting is that if the spread stays about the same, you are going to lose money after 6M and a year as you can see under “Historical Spread” – Low Scenario.
This is due to the powerful effect of carry and rolldown on a bond position. We have a steeper curve (rolldown) in the front and flatter in the back. To keep the trade duration (DV01) neutral, you are also selling more of the 5y bond, which means more negative carry.
And in “Target Horizon Yield” scenario, you need the yields go down >16bps on both your 5y and 10y bond in a year to breakeven as your position becomes a 4s9s flattener. The whole curve is effectively flatter assuming little decline in yields in the front end.
Another important point is that when you put on a bond trade, you will have to be right on both your direction, magnitude, and timing because you have to overcome the carry and rolldown of your trade.
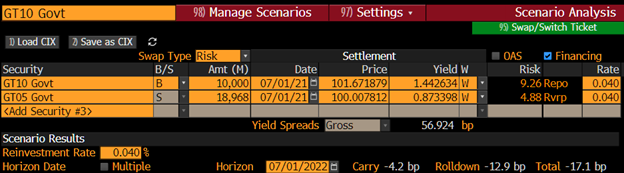
In the case of 5s10s flattener over a one year horizon, you have a negative carry of 4.2bps, and negative rolldown of 12.9bps.
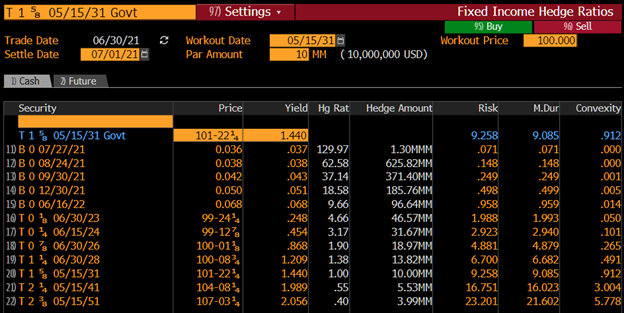
Another function you can find your hedging need for your curve trade is FIHR <GO>. It gives the hedge amount you need to trade to match the primary position. Here, we assume a yield beta of 1, that means you expect the movement between your primary and hedge positions to be 1:1.
Assuming yield beta of 1 is typical when you are considering a curve trade. Here is the look at the cash bond hedges.
OK, now let’s say you think the yield curve is going to twist and do a positive butterfly, i.e., you expect yield in the belly to outperform the front- and back- ends.
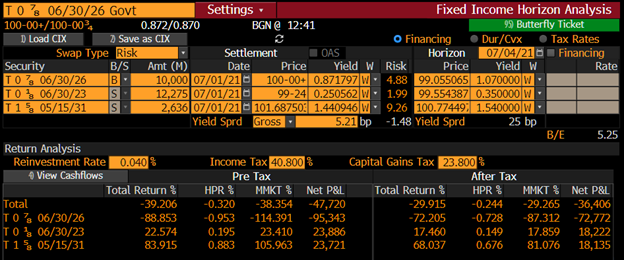
For example, you believe the 5y to outperform 2y and 10y, and that 2y5y10y (BBG: BF020510) will decline, and you want to structure a trade to express a view, you can run BFLY <GO>. You can trade them with cash bonds or futures.

Here, you are buying $10MM 5y and selling $12.3MM 2y and $2.6MM 10y at a yield spread of 5.2bps. Your DV01 is about $4,880. Here are the PnL scenarios for parallel shifts & spread move. Because of carry and roll, you will be fine with parallel downward shifts with better PnL.
Let’s say the butterfly does a positive shift (more negative spreads), you will make money. Conversely, you lose money if there is a negative shift (more positive spreads).

Recap:
Why do we care about the yield curve? It tells you something about the economic cycles & central bank policy. It also gives you an idea about the carry & roll. Buying a bond on the steepest part of the curve when the curve is also steep is a nice positive carry trade.
Why do we care about the yield curve? It tells you something about the economic cycles & central bank policy. It also gives you an idea about the carry & roll. Buying a bond on the steepest part of the curve when the curve is also steep is a nice positive carry trade.
Why do we want to do all these curve trades? Mainly, because you have a view on the yield curve, or you have a higher confidence about the curve movement (relative to expectations) than the yield movement.
How do we want to do curve trades properly? We want to keep interest rate risk to the minimum and take only the curve risk. If you have a view on duration, consider it as a separate trade and manage its risk separately.
You also want to check your duration trade against your curve trade, so you are not doubling on the same bet. Simply go to (BETA <GO>) to look at the relationship between your curve trade and the key rate (say 10y or 5y).

Bonus questions: if you want to express a view on the relative steepness between the US and European curves, how would you structure the trade? What do you need to do to remove unintended risks? What macro scenarios will be favorable for your trades? And will your trade not work?
That's a wrap. Thank you for reading!
Thanks Jorge for bringing up the GOVY function. You can look at relative value and carry and roll of government bonds directly. The power of Fintwit!
https://twitter.com/JorgeCalderonMx/status/1410623969414336514?s=20
• • •
Missing some Tweet in this thread? You can try to
force a refresh