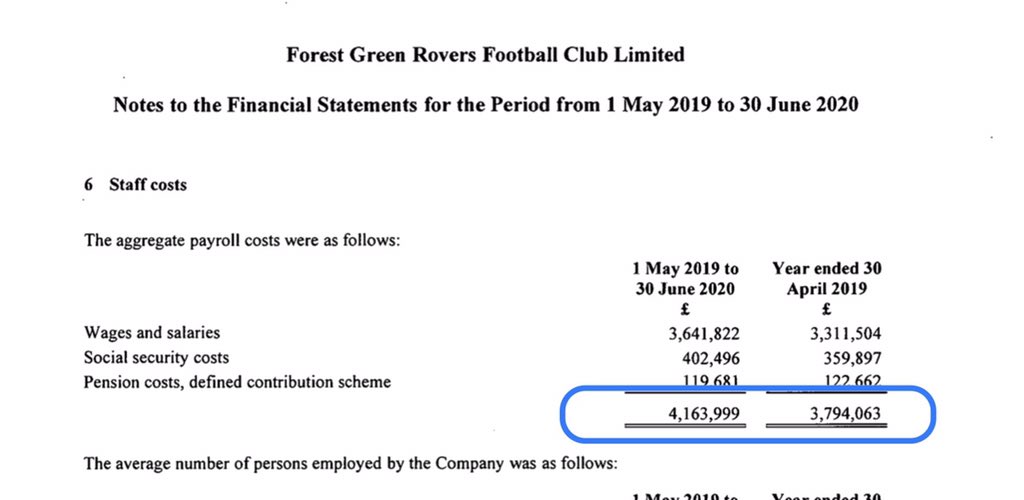
Forest Green Rovers of League Two do publish full accounts for 14 months accounts for 19/20 and made a profit of £800k, although the club did receive over £2.6m of sponsorship from other companies in the group #FGR
FGR cash substantially down and total losses over the years exceed £12.7 million.
FGR income up 30% despite Covid. Matchday income just 11% of total as commercial income from other companies in group substantial. Also had furlough income of £433k & £250k from Bolton after professional wrong ‘un weaselled on Christian Doidge deal
FGR wages up mainly due to longer accounting period. Wages 63% of revenue.
FGR signed players for £64k in 2019/20
FGR owed £5.6m to other companies in the group.
• • •
Missing some Tweet in this thread? You can try to
force a refresh
A history of Premier League transfer spending. First season (1992/93) total spend was £65m and QPR spent just £197k. Newly promoted Blackburn were the biggest spenders due to Jack Walker's investment in the likes of Alan Shearer, Stuart Ripley, Kevin Gallagher & Graham Le Saux.
1993/94 spending up to £78m. Blackburn continue to be the biggest spenders, Champions Manchester United were outspent by...err...Swindon.
First £100m spend season, Everton became the first team to eight figures spent in a season with Ferguson, Samways, Amokachi and Barrett all joining the club on big deals. QPR again smallest spenders. Man City and Chelsea outspent by Wimbledon.
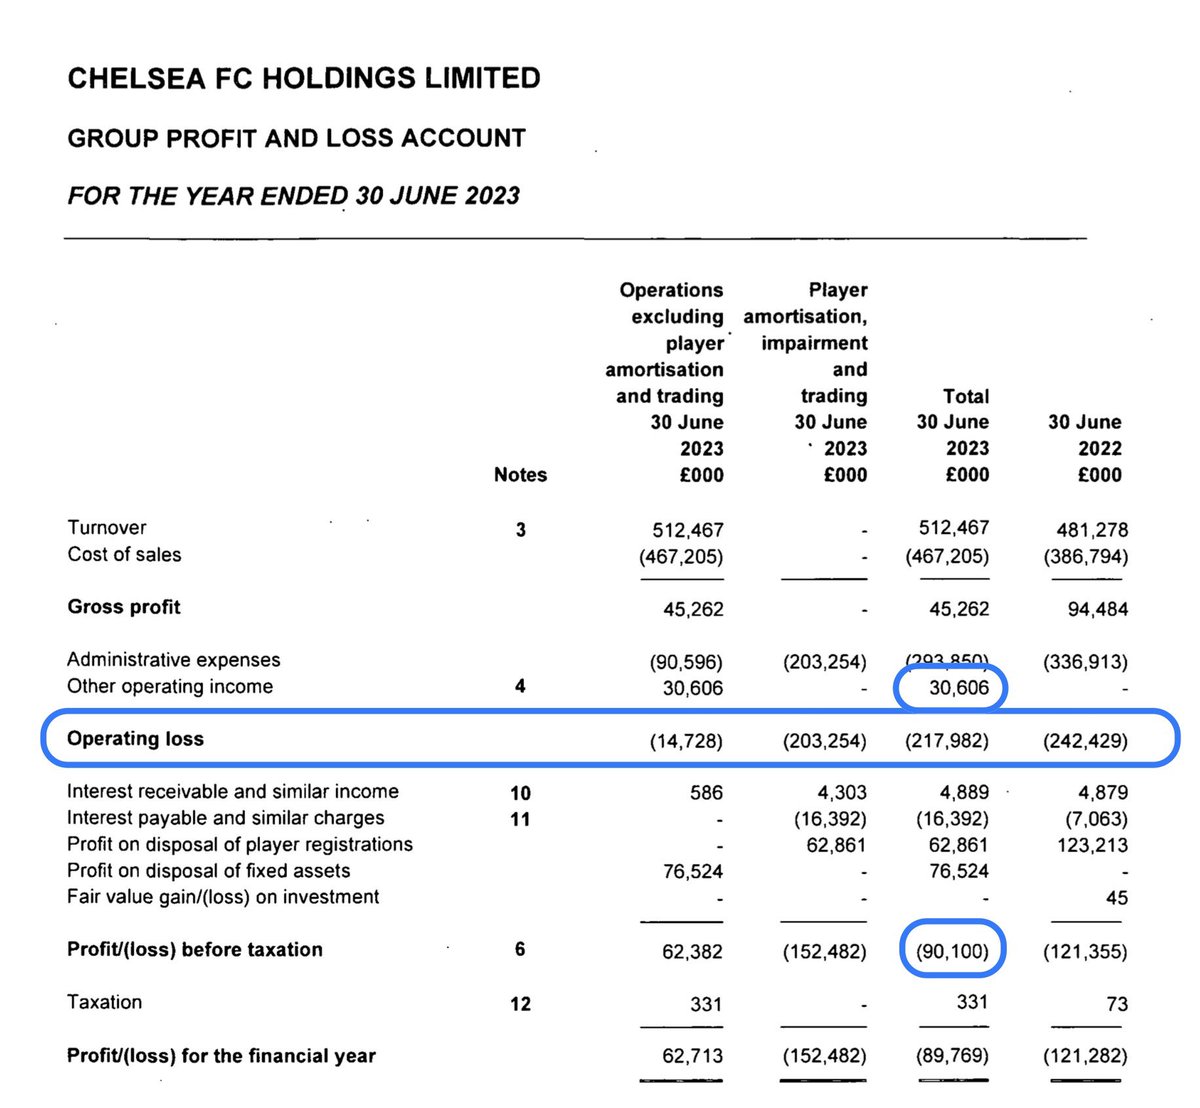
Chelsea FC Holdings submit 22/23 accounts. 🔑 figs
⚽️Revenue £512m ⬆️ 6%
⚽️Wages £404m ⬆️ 18%
⚽️Player costs (wages & amortisation) £119 for every £100 of revenue
⚽️Day to day losses £249m
⚽️Player purchases £745m
⚽️Player sales £203m
⚽️Borrowings in year £428m
Losses ⬆️ from £242m to £249m for day to day running of club but sale of hotel to another part of group, £30m of financial settlements & player sales ⬇️ this to £90m
Chelsea have cash in bank, total losses adding all the years together now £1.135 billion
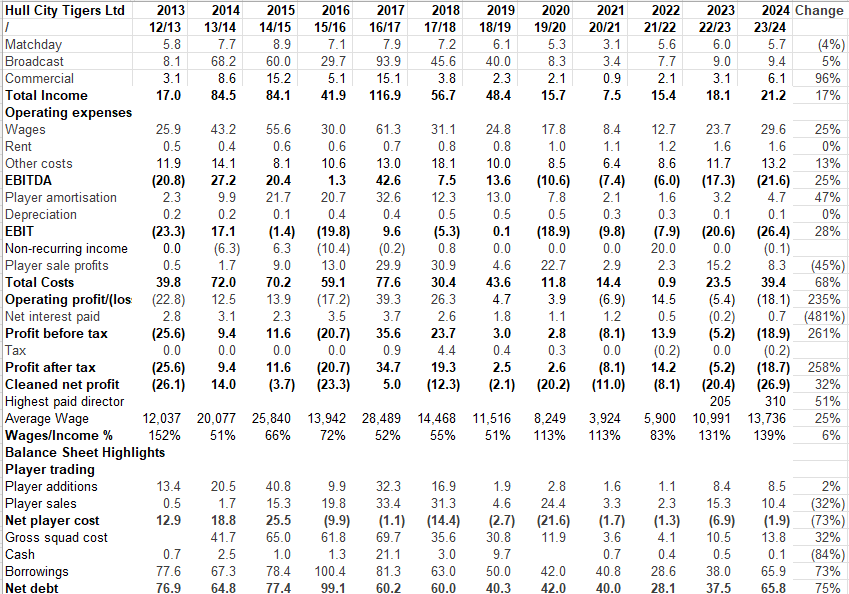
Whilst #Rovers 🔑 revenue streams, matchday, broadcast & commercial all ⬆️ significantly. However general overheads ⬆️ too which meant no change to op losses. Sale of Armstrong in 21/22 halved losses
Both accounts & audit report reference that there is a material uncertainty over ability of club to trade as a going concern. Should no noted that audit report dated December 2023 & things may have improved since then
Burnley publish 22/23 accounts; 🔑 figs
Revenue £65m ⬇️ 47%
Wages £54m ⬇️ 42%
Loss pre player sales £41m
Player purchases £84m
Player sales £21m
Borrowings £101m
Big change in pre tax profit of £36m in 21/22 to a loss of £36m in 22/23. Mainly due to ⬇️ in revenue following relegation and player sale profits ⬇️ from £54m to £11m.
Burnley still have substantial cash but this due to the Club borrowing substantial amounts during the year as liabilities ⬆️. Burnley still profitable over the years.
Leicester announce 22/23 accounts for 13 months to 30 June. 🔑 figs
Revenue £177m ⬇️ 17%
Wages £206m ⬆️ 13%
Loss pre player sales £152m ⬆️ 91%
Player sale profits £75m
Player purchases £53m
Player sales £104m
Extending financial year from 31 May to 30 June allowed Leicester to squeeze in sales of Maddison but pre tax loss (start point for PSR) still £90m.
Leicester total losses over the years now £295m. Liabilities ⬇️ after owner converted loans into shares.
Everton publish 22/23 accounts: 🔑 figs
Revenue £172m ⬇️ 5%
Wages £159m ⬇️ 2%
Amortisation £77m ⬆️ 23%
Manager/coaching payoff £7m
Executive payoff £2.5m
Loss pre player sales £130m
Pre tax loss £89m
Player signings £91m
Player sales £61m
Borrowings £341m
Losses ⬆️ due to no longer having Usmanov sponsor deals, wage ⬇️ modest & interest costs doubling
Cash balance down as club dealing with significant monthly demands in terms of meeting payroll and new stadium costs. Total losses over the years now £550m