Council of Economic Advisers Profile picture
Jul 13, 2021 8 tweets 3 min read Read on X
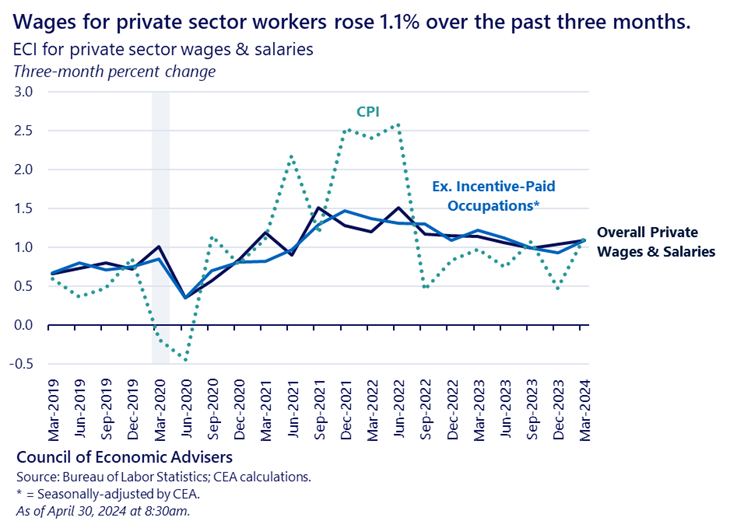
Inflation as measured by CPI increased at a 5.4% rate year-over-year last month and 0.9% month-over-month. Core inflation—without food/energy—rose 4.5% year-over-year and 0.9% month-over-month. A large part of the increase is due to cars and pandemic-affected services. 1/ Image
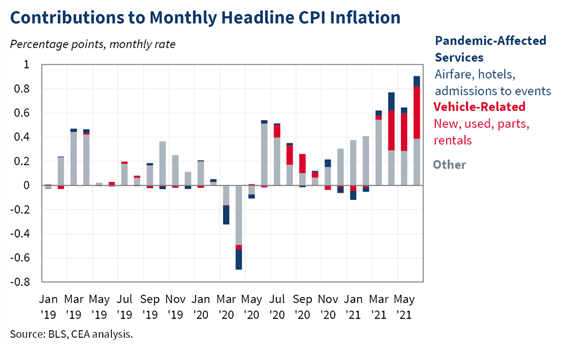
Cars once again accounted for a large share of the increase. Used cars, new cars, auto parts, and car rentals together made up about 60 percent of core month-over-month inflation 2/ Image
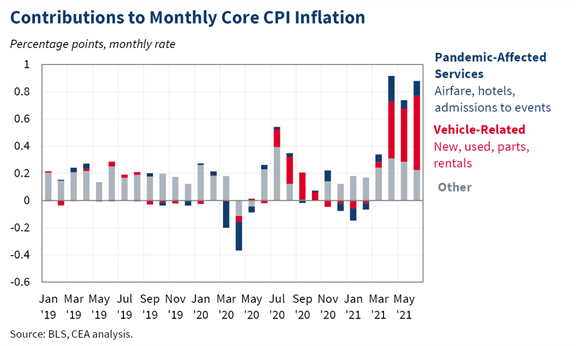
Prices of pandemic-affected services rose again this month and contributed 11 basis points to the core inflation increase in June. 3/ Image
Without cars and pandemic-affected services, core inflation rose 0.22 percent month-over-month, relative to 0.28 percent in May and 0.31 percent in April 4/ Image
The year-over-year numbers were impacted by base effects from last year, although the impact of base effects is starting to move out of the data. Starting in July, year-over-year changes in CPI will be calculated off of a price level that is above the pre-pandemic level. 5/
Controlling for base effects by smoothing across the 16 months since February 2020, the rate of CPI inflation was 3.5%. 6/ Image
In core inflation, controlling for base effects the rate of annualized CPI inflation was 3.1% 7/ Image
We know that the recovery from the pandemic will not be linear. The Council of Economic Advisers will continue to monitor the data as they come in. /end

• • •

Missing some Tweet in this thread? You can try to force a refresh
 

Keep Current with Council of Economic Advisers

Council of Economic Advisers Profile picture

Stay in touch and get notified when new unrolls are available from this author!

Read all threads

This Thread may be Removed Anytime!

PDF

Twitter may remove this content at anytime! Save it as PDF for later use!

Try unrolling a thread yourself!

how to unroll video
  1. Follow @ThreadReaderApp to mention us!

  2. From a Twitter thread mention us with a keyword "unroll"
@threadreaderapp unroll

Practice here first or read more on our help page!

More from @WhiteHouseCEA

May 3
Today’s employment report shows the U.S. economy added 175,000 jobs in April, a bit below expectations. Revisions to prior months’ estimates were relatively small on net. Through April, the average three-month gain in payrolls was a healthy 242,000. 1/ Image
The unemp. rate ticked up to 3.9% in April, the 27th straight month below 4%, tied for the longest period since the late 1960s. The broadest measure of underemployment, U-6—including those working part-time for economic reasons and the marginally attached—ticked up to 7.4%. 2/ Image
The unemployment rate of Black workers fell to 5.6%, reversing its rise last month. The unemployment rates for Hispanic and Asian workers ticked up to 4.8% and 2.8%, respectively, but both remain lower than their rates last at the end of last year. 3/ Image
Read 13 tweets
Apr 30
Today’s Employment Cost Index (ECI) release shows that wages for private sector workers grew 1.1% between December and March, slightly higher than the three-month growth of 1.0% through December, and somewhat elevated versus the 0.8% average in 2018 & 2019. 1/ Image
Excluding incentive-paid occupations—in which pay tends to be more volatile—private-sector wage growth was also 1.1%. 2/
Total compensation for all civilian workers (except those in the federal government) rose 1.2% in the three months ending in March, a bit higher than the 0.9% growth in the three months through December. 3/
Read 6 tweets
Apr 25
Today’s report—the advance estimate of first quarter GDP in 2024—shows that real GDP grew by 1.6% in Q1, below expectations of 2.5%. Growth in Q1 primarily reflected contributions from consumption and private fixed investment. 1/ Image
Real private domestic final purchases (PDFP), which removes net exports, inventory investment, and government spending, is estimated to have grown by 3.1% at an annualized rate, a strong pace. In 2023:H2, real PDFP grew by a similar average pace of 3.2%. 2/ Image
As the CEA discussed in the 2015 Economic Report of the President, PDFP can be a better measure of underlying GDP growth because it removes some of the more volatile elements of GDP that may not predict growth in future quarters. 3/

obamawhitehouse.archives.gov/sites/default/…
Read 12 tweets
Apr 10
Both headline and core prices as measured by the CPI grew 0.4% from February to March, the same as the increases in the prior month, but both a tick above market expectations. 1/ Image
Year-over-year headline inflation increased 0.3 ppt to 3.5% in March, well below its rate of 5% a year ago. Core inflation was 3.8% over the year, the same as February’s rate and down from 5.6% a year ago. 2/ Image
Core inflation was broadly lower than it was last year at the 3-, 6-, and 12-month frequencies. For example, 6M annualized core CPI inflation was 3.9% in March, lower than the 4.6% rate in March of last year. /3 Image
Read 13 tweets
Apr 3
The clean energy transition is under way, creating an innovative U.S. economy powered by cheap, reliable, and secure clean energy. This transition will address the climate crisis and provide new sources of economic growth, employment, and prosperity. 1/
The United States can meet these goals by accelerating two recent developments:

1. Shift electricity generation from fossil fuels to clean energy.
2. Electrify other sectors to use clean electricity. 2/ Image
This is a fundamental change in how energy powers the U.S. economy. Economists characterize such transitions as STRUCTURAL CHANGE: long-term shifts in an economy’s inputs, in this case from dirty to clean energy. 3/
Read 11 tweets
Mar 21
Today, the Council of Economic Advisers under the leadership of @econjared46 released the 2024 Economic Report of the President.

whitehouse.gov/cea/written-ma…
Ch 1, The Benefits of Full Employment, dedicated to the late William Spriggs, examines the macroeconomic and labor market impacts of full employment and tight labor markets, with a particular focus on the benefits for traditionally disadvantaged workers.

whitehouse.gov/wp-content/upl…
Ch 2, The Year in Review and the Years Ahead, describes macroeconomic trends during 2023 and presents the Federal government’s FY 2024 macroeconomic forecast.

whitehouse.gov/wp-content/upl…
Read 8 tweets

Did Thread Reader help you today?

Support us! We are indie developers!


This site is made by just two indie developers on a laptop doing marketing, support and development! Read more about the story.

Become a Premium Member ($3/month or $30/year) and get exclusive features!

Become Premium

Don't want to be a Premium member but still want to support us?

Make a small donation by buying us coffee ($5) or help with server cost ($10)

Donate via Paypal

Or Donate anonymously using crypto!

Ethereum

0xfe58350B80634f60Fa6Dc149a72b4DFbc17D341E copy

Bitcoin

3ATGMxNzCUFzxpMCHL5sWSt4DVtS8UqXpi copy

Thank you for your support!

Follow Us!

:(