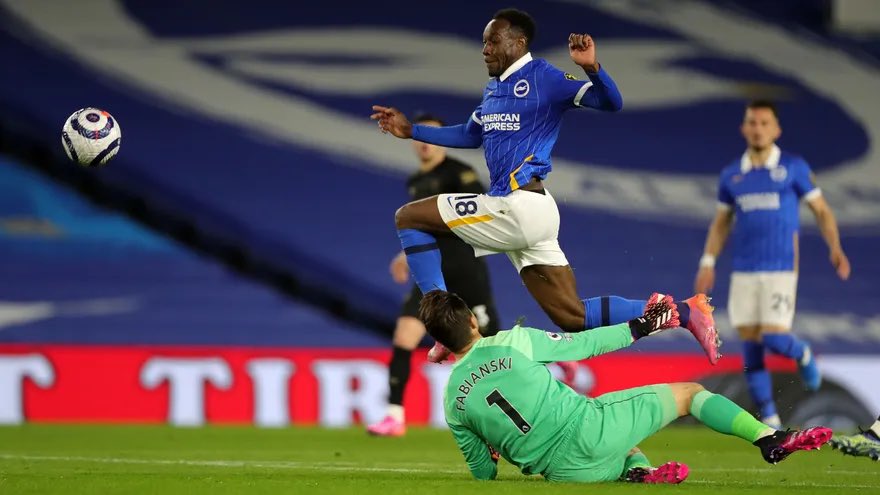
[THREAD] Analysing the factors behind Brighton’s 49 goals scored (all competitions) in the 2020/21 season.
#BHAFC
#BHAFC

This thread was largely inspired by @doublepass and the analysis of #EURO2020 goals by @kevnicholson1 - see the graphic below.
#BHAFC
#BHAFC

Data for goal timings was taken from @StatsZone, but all data beyond that was manually coded from @Wyscout footage.
#BHAFC
#BHAFC
Brighton scored 49 goals in 44 games (all competitions) in the 20/21 season; 1.11 goals-per-game average is a Premier League club record.
The Albion set further club records last campaign for most goals scored in a Premier League season (40) and games scored in (26/38).
#BHAFC
The Albion set further club records last campaign for most goals scored in a Premier League season (40) and games scored in (26/38).
#BHAFC

This thread will analyse the goals in terms of:
• Time in game
• Shot location
• Finish method
• Assist method and zone
• Sequence length (time + passes)
• Possession start location (open-play goals)
• Opposition defensive structure
• Comparison to UCL sides
#BHAFC
• Time in game
• Shot location
• Finish method
• Assist method and zone
• Sequence length (time + passes)
• Possession start location (open-play goals)
• Opposition defensive structure
• Comparison to UCL sides
#BHAFC
1. Time in game
0 to 15 mins: 8 goals
16 to 30 mins: 5 goals
31 to 45+ mins: 7 goals
46-60 mins: 13 goals
61-75 mins: 6 goals
76-90+ mins: 10 goals
⏰
#BHAFC
0 to 15 mins: 8 goals
16 to 30 mins: 5 goals
31 to 45+ mins: 7 goals
46-60 mins: 13 goals
61-75 mins: 6 goals
76-90+ mins: 10 goals
⏰
#BHAFC
20 goals were scored in the 1st half, 29 in the 2nd half.
The earliest goal came after 4 minutes (Maupay at Newcastle) and the latest goal was scored at 90+5 (March v Manchester United).
#BHAFC
The earliest goal came after 4 minutes (Maupay at Newcastle) and the latest goal was scored at 90+5 (March v Manchester United).
#BHAFC

2. Shot location
• 8 goals from outside the box (16.67%)
• 31 goals in the penalty area, excluding six-yard box (64.58%)
• 9 goals in the six-yard box (18.75%)
Including the six-yard box, over 83% of Brighton’s goals were scored from inside the penalty area.
#BHAFC
• 8 goals from outside the box (16.67%)
• 31 goals in the penalty area, excluding six-yard box (64.58%)
• 9 goals in the six-yard box (18.75%)
Including the six-yard box, over 83% of Brighton’s goals were scored from inside the penalty area.
#BHAFC

3. Finish method
• 34 right-foot goals (70.83%)
• 9 headers (18.75%)
• 5 left-foot goals (10.42%)
• 30 1-touch goals (62.5%)
• 18 multi-touch goals (37.5%)
72.5% of goals inside the penalty area were 1-touch finishes; 7/8 goals outside the box were multi-touch.
#BHAFC
• 34 right-foot goals (70.83%)
• 9 headers (18.75%)
• 5 left-foot goals (10.42%)
• 30 1-touch goals (62.5%)
• 18 multi-touch goals (37.5%)
72.5% of goals inside the penalty area were 1-touch finishes; 7/8 goals outside the box were multi-touch.
#BHAFC

Lewis Dunk (4) scored more headed goals than any Brighton player last season.
All six of Brighton’s goals that were assisted directly from a corner (or cross from a short corner) were out-swinging deliveries.
#BHAFC
All six of Brighton’s goals that were assisted directly from a corner (or cross from a short corner) were out-swinging deliveries.
#BHAFC

Danny Welbeck was the only Brighton player last season to score from inside the 6-yard box, inside the 18-yard box, and from outside the box.
He scored twice in each zone.
#BHAFC
He scored twice in each zone.
#BHAFC

4. Assist method
9 goals from crosses (22%)
8 goals from passes (20%)
5 goals from through balls (12%)
5 goals from dribbles (12%)
5 goals from cutbacks (12%)
5 goals from corners (12%)
4 ‘chaos’ goals - loose balls (10%)
#BHAFC
9 goals from crosses (22%)
8 goals from passes (20%)
5 goals from through balls (12%)
5 goals from dribbles (12%)
5 goals from cutbacks (12%)
5 goals from corners (12%)
4 ‘chaos’ goals - loose balls (10%)
#BHAFC

Combined, 39.5% of goals were assisted via direct corners, crosses and cutbacks.
Danny Welbeck was involved in 3/5 goals assisted via through balls, scoring twice (Aston Villa, West Ham) and assisting once (Southampton).
#BHAFC
Danny Welbeck was involved in 3/5 goals assisted via through balls, scoring twice (Aston Villa, West Ham) and assisting once (Southampton).
#BHAFC

4. Assists zone
Brighton’s top 3 assist zones:
1. Zone 18 (high, wide right)
2. Zone 14 (directly outside the box)
3. Zone 17 (penalty area)
Combined, over 61% of goals were assisted from zones 18 and 14.
#BHAFC
Brighton’s top 3 assist zones:
1. Zone 18 (high, wide right)
2. Zone 14 (directly outside the box)
3. Zone 17 (penalty area)
Combined, over 61% of goals were assisted from zones 18 and 14.
#BHAFC

Zone 14 is a well-researched area in performance analysis.
A study of four men’s World Cups (2002-2014) found around 1/3 of goals to be assisted from zone 14.
9 of Brighton’s 13 goals from passes + through balls were assisted from zone 14.
researchgate.net/profile/Ronald…
#BHAFC
A study of four men’s World Cups (2002-2014) found around 1/3 of goals to be assisted from zone 14.
9 of Brighton’s 13 goals from passes + through balls were assisted from zone 14.
researchgate.net/profile/Ronald…
#BHAFC
Brighton registered over four times the number of assists from the right flank (18) as they did from the left flank (4).
Interestingly, @WhoScored data has Brighton’s attack frequencies down the left and right as equal (37% of attacks coming down both).
#BHAFC
Interestingly, @WhoScored data has Brighton’s attack frequencies down the left and right as equal (37% of attacks coming down both).
#BHAFC
5. Sequence length + time (open-play goals)
On average, open-play goals were scored from sequences of 6 passes lasting 20 seconds. Brighton scored 6 times from sequences of 10+ passes.
This is an improvement on last season (see article).
attackingcentreback.wordpress.com/2019/11/23/why…
#BHAFC
On average, open-play goals were scored from sequences of 6 passes lasting 20 seconds. Brighton scored 6 times from sequences of 10+ passes.
This is an improvement on last season (see article).
attackingcentreback.wordpress.com/2019/11/23/why…
#BHAFC
6. Possession start location (open-play goals)
• 11 goals from possessions starting in defensive 1/3 (31.43%)
• 13 goals from possessions starting in midfield 1/3 (37.14%)
• 11 goals from possessions starting in final 1/3 (31.43%)
#BHAFC
• 11 goals from possessions starting in defensive 1/3 (31.43%)
• 13 goals from possessions starting in midfield 1/3 (37.14%)
• 11 goals from possessions starting in final 1/3 (31.43%)
#BHAFC

7. Opposition defensive structure (set piece goals excluded)
• 23 goals scored versus organised (set) defence (65.7%)
• 12 goals scored versus disorganised defence (34.3%)
#BHAFC
• 23 goals scored versus organised (set) defence (65.7%)
• 12 goals scored versus disorganised defence (34.3%)
#BHAFC

Versus an organised defence, 11 of 23 goals (47.8%) were scored from crosses + cutbacks - playing around teams was most effective.
Versus a disorganised defence, 6 of 12 goals (50%) were scored from dribbles + through balls - playing through teams was most effective.
#BHAFC
Versus a disorganised defence, 6 of 12 goals (50%) were scored from dribbles + through balls - playing through teams was most effective.
#BHAFC

Compared to 2016/17 UCL teams, Brighton scored a higher % of:
• Set piece goals
• Headers
• Open-play goals from crosses
They were similar in terms of:
• % of goals scored versus organised + disorganised defences
• % of goals 1-touch finish
researchgate.net/profile/Joaqui…
#BHAFC
• Set piece goals
• Headers
• Open-play goals from crosses
They were similar in terms of:
• % of goals scored versus organised + disorganised defences
• % of goals 1-touch finish
researchgate.net/profile/Joaqui…
#BHAFC
For more content, check out the Albion Analytics section on the @OfficialBHAFC website.
brightonandhovealbion.com/news/albion-an…
#BHAFC
brightonandhovealbion.com/news/albion-an…
#BHAFC
If you’d like to support the page further, then please consider becoming a patron.
You’ll unlock exclusive content and all subscriptions for the month of July are being donated to @The_REMF.
Patreon.com/AlbionAnalytics
You’ll unlock exclusive content and all subscriptions for the month of July are being donated to @The_REMF.
Patreon.com/AlbionAnalytics
• • •
Missing some Tweet in this thread? You can try to
force a refresh


