NEW: people worry when they hear "40% of hospitalisations are fully vaxxed", but this chart shows that's actually good news.
The more people you vaccinate, the higher their share of hospitalisations, but the *total* number in hospital is a fraction of what it would otherwise be
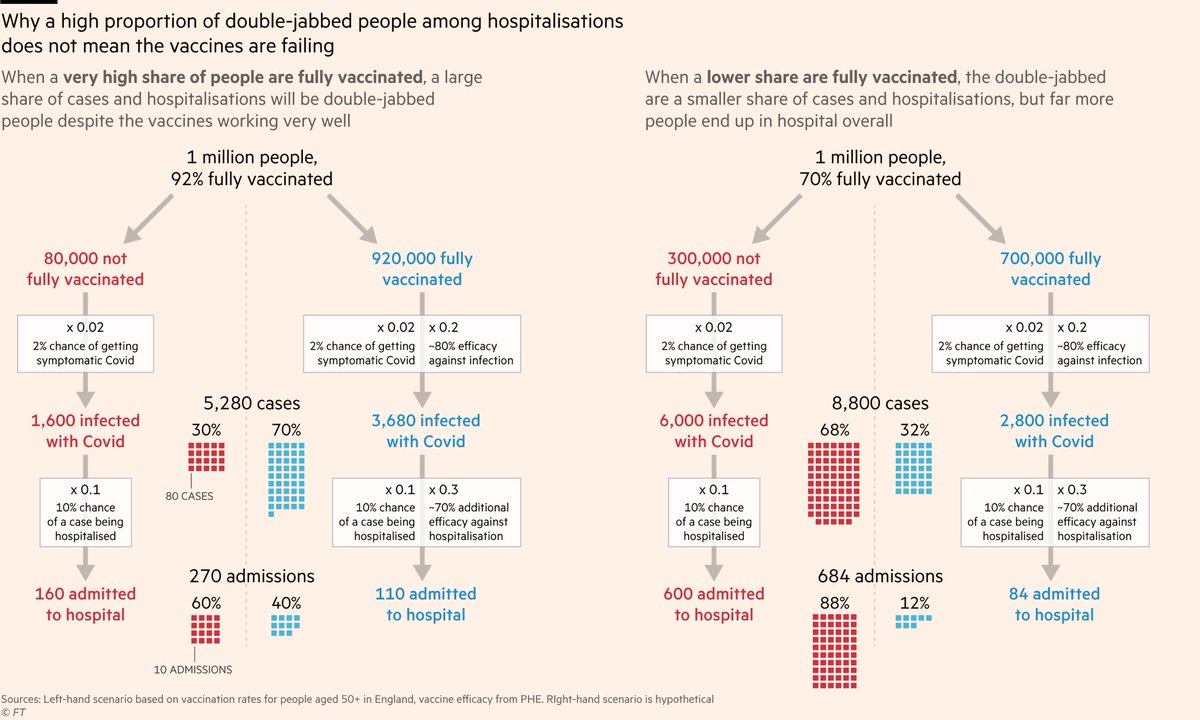
If fewer people are fully vaccinated, a smaller share of hospitalisations will be fully-vaxxed too, but this is not a good thing:
Overall there will be a lot more people in hospital because far more of the population is unprotected.
In other words: if you want to know whether the vaccination program is working, don't focus on whether the fully vaxxed make up 40% or 12% of hospitalisations.
Focus on whether the hospitalisation rate is 270 per million or 684 per million.
And since this is Twitter, I've prepared the same thing in meme form
But back to charts:
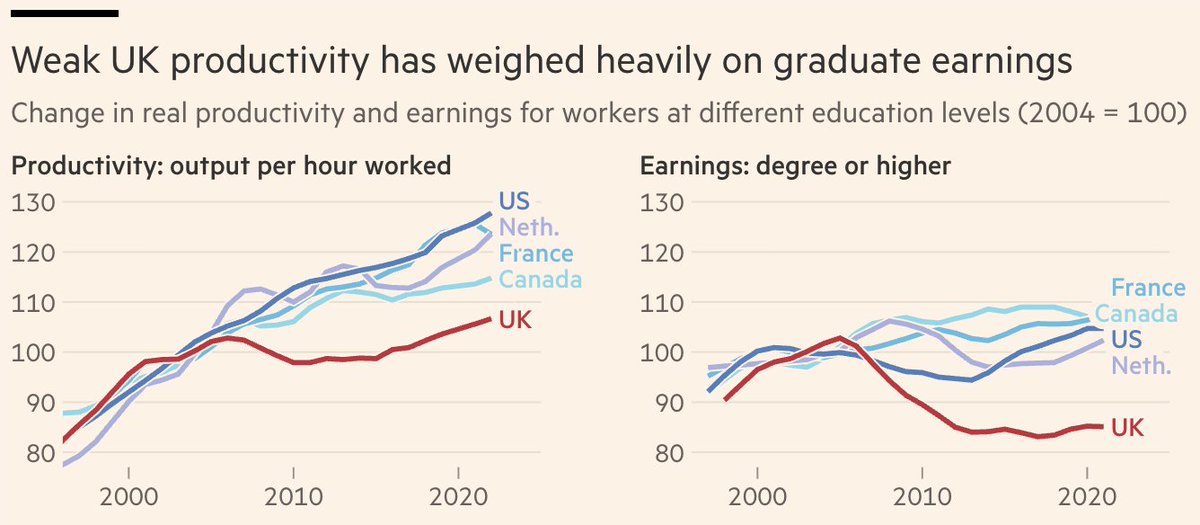
All the data we have suggests vaccines are working remarkably well. Far beyond what had been hoped for a year ago.
For example, a fully-vaxxed 80-year-old now has the same risk of dying from Covid as an unvaxxxed 50-year-old. That's an enormous drop in risk!
And we can see the game-changing impact of vaccinations clearly in the English hospitalisation data.
If it weren't for vaccines, more Covid patients would have been admitted to hospital yesterday than at the height of the winter peak. Instead we're 75% below it.
...which features other excellent lines like this from @anthonybmasters, who has a brilliant seatbelt analogy for vaccines
And finally you should also read @TimHarford's latest, which discusses the "fully vaxxed share of hospitalisations" paradox alongside other features of the pandemic which defy our intuition ft.com/content/0f11b2…
As always, if you have any questions, comments etc please leave them here or DM, and I'll do my best to answer as many as possible 🙏
• • •
Missing some Tweet in this thread? You can try to
force a refresh
Some people have responded to that chart with "That can’t be right", or "We can’t be worse than America".
I’m afraid the chart is right. 15 years ago the UK’s record on homelessness *was* not too dissimilar to other developed countries, but things have rapidly deteriorated.
There has long been a gap between people’s views of crime locally (not a big issue) vs nationally (it’s terrible out there!), but there are signs this is now happening to economic perceptions too.
My finances? Going okay. The economy? Awful.
What’s going on?
My column this week asks whether the media (both mainstream and social) and its incentives to maximise engagement could be playing a key role ft.com/content/8cd76c…
With crime, it’s widely accepted that the main reason for this decoupling is media coverage.
People’s sense of crime levels is based mainly on what they see on TV and read in newspapers, and much less on what they or the people they know actually experience.
NEW: my column this week is about the coming vibe shift, from Boomers vs Millennials to huge wealth inequality *between* Millennials.
Current discourse centres on how the average Millennial is worse-off than the average Boomer was, but the richest millennials are loaded 💸🚀
That data was for the UK, but it’s a similar story in the US. The gap between the richest and poorest Millennials is far wider than it was for Boomers. More debt at the bottom, and much more wealth at the top.
In both countries, inequality is overwhelmingly *within* generations, not between them.
And how have the richest millennials got so rich?
Mainly this: enormous wealth transfers from their parents, typically to help with buying their first home.
In the UK, among those who get parental help, the top 10% got *£170,000* towards their house (the average Millennial got zero).
American politics is in the midst of a racial realignment.
I think this is simultaneously one of the most important social trends in the US today, and one of the most poorly understood.
Last week, an NYT poll showed Biden leading Trump by less than 10 points among non-white Americans, a group he won by almost 50 points in 2020.
Averaging all recent polls (thnx @admcrlsn), the Democrats are losing more ground with non-white voters than any other demographic.
People often respond to these figures with accusations of polling error, but this isn’t just one rogue result.
High quality, long-running surveys like this from Gallup have been showing a steepening decline in Black and Latino voters identifying as Democrats for several years.
The politics of America’s housing issues in one chart:
• People and politicians in blue states say they care deeply about the housing crisis and homelessness but keep blocking housing so both get worse
• Red states simply permit loads of new homes and have no housing crisis
And if you were wondering where London fits into this...
It builds even less than San Francisco, and its house prices have risen even faster.
That cities like London & SF (and the people who run them) are considered progressive while overseeing these situations is ... something
Those charts are from my latest column, in which I argue that we need to stop talking about the housing crisis, and start talking about the planning/permitting crisis, because it’s all downstream from that ft.com/content/de34df…
NEW: we often talk about an age divide in politics, with young people much less conservative than the old.
But this is much more a British phenomenon than a global one.
40% of young Americans voted Trump in 2020. But only 10% of UK under-30s support the Conservatives. Why?
One factor is that another narrative often framed as universal turns out to be much worse in the UK: the sense that young generations are getting screwed.
Young people are struggling to get onto the housing ladder in many countries, but the crisis is especially deep in Britain:
It’s a similar story for incomes, where Millennials in the UK have not made any progress on Gen X, while young Americans are soaring to record highs.
Young Brits have had a much more visceral experience of failing to make economic progress.