1/
Y'all asked, so here it is.
This is a thread on finding successful trades - example provided!
I cover -
1. What a good technical set up is,
2. Setting an entry, and
3. Setting a target.
👇
Y'all asked, so here it is.
This is a thread on finding successful trades - example provided!
I cover -
1. What a good technical set up is,
2. Setting an entry, and
3. Setting a target.
👇
2/
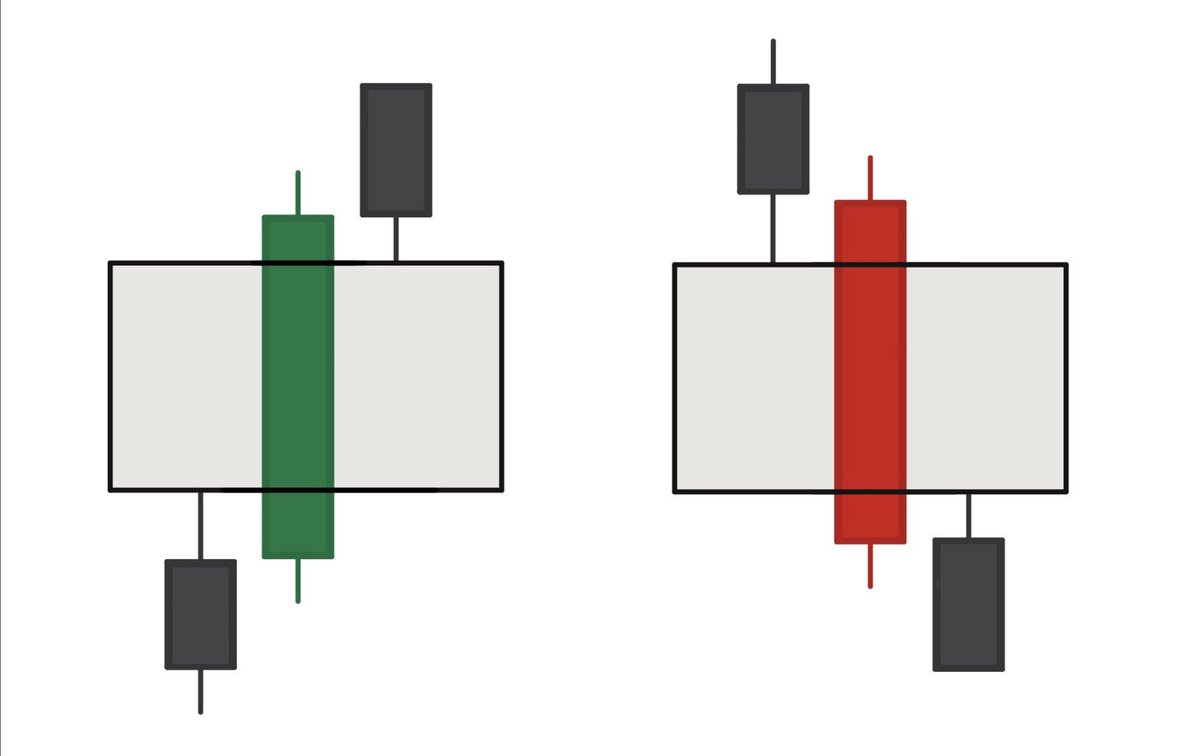
What technical set up is likely to work?
We're looking for ONLY one thing - time frame continuity. This means that the higher time frames should be in your favor when taking a trade.
i.e. the day, week, and month are all green if bullish or red if bearish.
What technical set up is likely to work?
We're looking for ONLY one thing - time frame continuity. This means that the higher time frames should be in your favor when taking a trade.
i.e. the day, week, and month are all green if bullish or red if bearish.
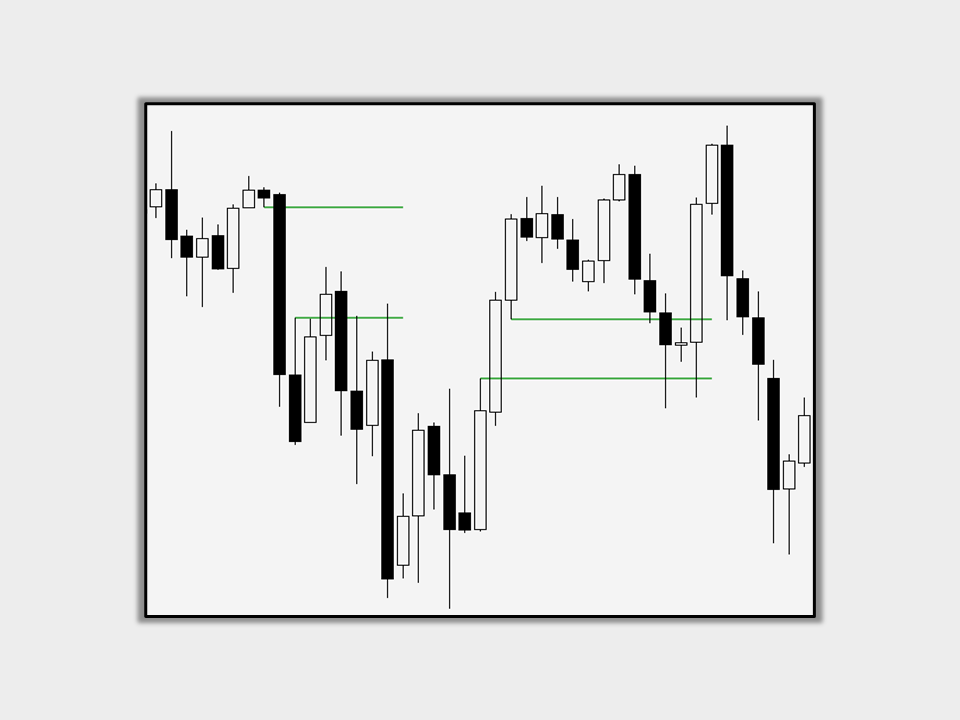
3/
Ex: $CCIV / $LCID from my 6/28 - 7/2 watchlist.
My thesis = bullish. Why?
The month was bright green in June (bottom right chart).
The options flow via @unusual_whales was also bullish.
Once we know the chart and options flow are both in our favor, we then plan the trade.
Ex: $CCIV / $LCID from my 6/28 - 7/2 watchlist.
My thesis = bullish. Why?
The month was bright green in June (bottom right chart).
The options flow via @unusual_whales was also bullish.
Once we know the chart and options flow are both in our favor, we then plan the trade.


4/
When to enter the trade?
When the price crosses the previous week's high. Why? The new WEEK will then be GREEN, and in CONTINUITY with the MONTH.
i.e. we enter the trade on the DAY (small time frame), the WEEK and MONTH are both green (large time frames).
When to enter the trade?
When the price crosses the previous week's high. Why? The new WEEK will then be GREEN, and in CONTINUITY with the MONTH.
i.e. we enter the trade on the DAY (small time frame), the WEEK and MONTH are both green (large time frames).
5/
When to exit the trade?
Since our entry is based on the weekly time frame, our exit will be based on it as well.
The weekly chart on the right shows the entry in blue, and target in red.
Entry = above previous week's high
Target = next "high" price
When to exit the trade?
Since our entry is based on the weekly time frame, our exit will be based on it as well.
The weekly chart on the right shows the entry in blue, and target in red.
Entry = above previous week's high
Target = next "high" price

6/
The result?
$CCIV / $LCID was up +13% that week, and the options had great returns.
The principles outlined apply to ALL time frames. If you day-trade, ensure the hourly, daily, and weekly are in continuity instead of focusing on the monthly.
Time frame continuity is key!
The result?
$CCIV / $LCID was up +13% that week, and the options had great returns.
The principles outlined apply to ALL time frames. If you day-trade, ensure the hourly, daily, and weekly are in continuity instead of focusing on the monthly.
Time frame continuity is key!
7/
Is there a part you didn't understand or want more clarity on?
Comment or vote below. I'll provide more information on the topic.
Is there a part you didn't understand or want more clarity on?
Comment or vote below. I'll provide more information on the topic.
• • •
Missing some Tweet in this thread? You can try to
force a refresh