Newcastle finances headlines for 13m to 31/7/20
Revenue £153m (down 13%)
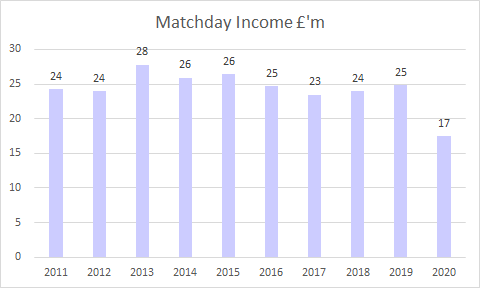
Matchday £17m (down 30%)
Wages £121m (up 20%)
Operating loss £43m (£11m profit)
Player purchases £76m (£43m)
Player sales £30m (£42m)
Lee Charnley salary £675k (£267k)
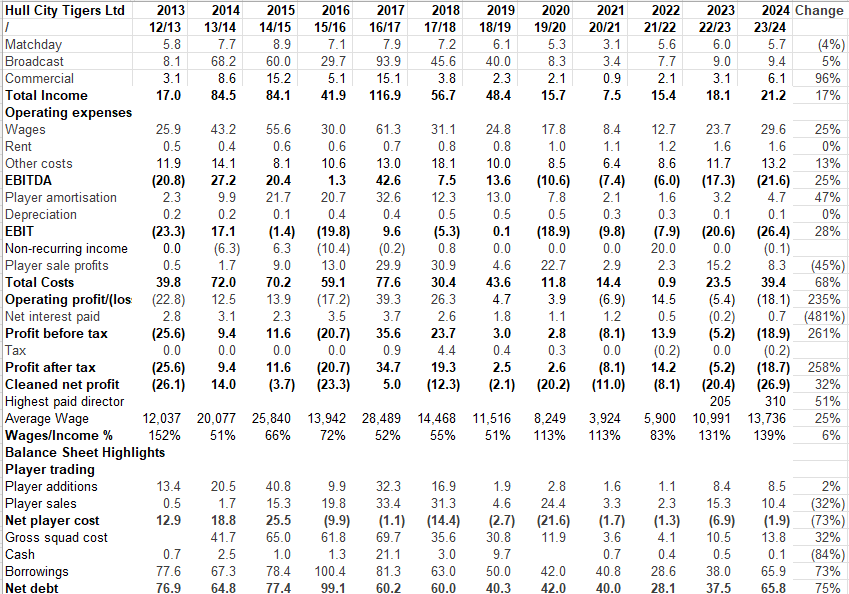
Total income includes full matches from 19/20 as accounts extended to 31 July, most other clubs only had 32 matches as published to 30 June.
Matchday income down 30%, partly due to Covid.
Broadcast income down £18m partly due to rebates to TV companies.
Commercial income broadly flat as has been the case for some years. Surprising that clubs such as Brighton and Leicester are ahead of Newcastle...or is it?
Wages up £20m but this included an extra month compared to previous season. Average wage almost £52k a week, which is enough for a night to remember in the Bigg Market on a Saturday night.
Player amortisation (transfer fees spread over contract period) is the other main cost for clubs. In addition Newcastle had a further £11m cost for 'impairment' which is management speak for signing someone who was a bit bobbins and so value written down.
Newcastle wages £79 for every £100 of income. Overall EPL spent £69.30.
Excluding one off costs and player sales, Newcastle lost £43m in 19/20. Total losses for EPL were £1,260m up from £728m
Newcastle made £26m from player sale profits in 2019/20. Total EPL profits were £400m
Newcastle player purchases £76m but this includes two Julys. Player sales £30m. Overall net spend in EPL £1.07 billion
Newcastle’s loans due to Mike Ashley still £107m but now classified as ‘repayable on demand’ instead of due in more than one year.
Newcastle have had a net transfer spend of £48m since July 2020
Newcastle's squad cost a total of £216m at 31 July 2020, which, whilst a record for the club, is still bottom six by EPL standards.
Newcastle Spreadsheet Summary under MA
EPL Spreadsheet summary for 2019/20
• • •
Missing some Tweet in this thread? You can try to
force a refresh
Bristol City publish 23/24 accounts: 🔑figs:
⚽️Revenue £42.4m ⬆️16% despite only covering 12 months instead of 13 in 22/23
⚽️Wages £34.9m ⬇️3%
⚽️Underlying losses £22.5m ⬇️20%
⚽️Player sale profits £21.7m ⬆️128%
⚽️Player purchases £3.7m
⚽️Player sales £21.7m
⚽️Total losses over the years £224m
⚽️Total Steve Lansdown investment £282.4m
Development at Ashton Gate has been a big driver of ⬆️revenue at Bristol City, with commercial income now 60% of total. This means that City generate more revenue than any other non-parachute payment club. (Most figures are for 2023, except for the clubs that have not published 2024 such as #BCFC, and Reading, who have a rogue owner who thinks the law does not apply to him).
Main costs for clubs are player related. Staff numbers slightly ⬆️but wage bill ⬇️ due to only 12 months period. Average weekly wage of £16K very competitive for a non-parachute team but wages continue to fall as a proportion of income. Other player related cost is amortisation (player transfers spread over contract life) and this is mid table by divisional standards.
Hull City publish 23/24 accounts: 🔑figures
⚽️Revenue £21.2m ⬆️17%
⚽️ Wages £29.6m ⬆️25%
⚽️Average weekly wage £13,700
⚽️Underlying losses £26.4m ⬆️28%
⚽️ Player sale profits £8.3m ⬇️45%
⚽️Player purchases £8.5m
⚽️Player sales £10.4m (plus £30m post season)
⚽️Loans from owner in year £27.9m
Revenue fairly evenly split, rise in year mainly due to better commercial sales and slight rises in matchday and new EFL TV deal. Only a handful of clubs have submitted 23/24 accounts, Reading's owner thinks the laws of the land do not apply to him so has not yet submitted 22/23
Main costs for clubs are player related. Substantial increase in wages and amortisation (player signings spread over contract length) as new owner invested heavily in playing talent resulting in Hull being at top end of non parachute payers.
A history of Premier League transfer spending. First season (1992/93) total spend was £65m and QPR spent just £197k. Newly promoted Blackburn were the biggest spenders due to Jack Walker's investment in the likes of Alan Shearer, Stuart Ripley, Kevin Gallagher & Graham Le Saux.
1993/94 spending up to £78m. Blackburn continue to be the biggest spenders, Champions Manchester United were outspent by...err...Swindon.
First £100m spend season, Everton became the first team to eight figures spent in a season with Ferguson, Samways, Amokachi and Barrett all joining the club on big deals. QPR again smallest spenders. Man City and Chelsea outspent by Wimbledon.
Chelsea FC Holdings submit 22/23 accounts. 🔑 figs
⚽️Revenue £512m ⬆️ 6%
⚽️Wages £404m ⬆️ 18%
⚽️Player costs (wages & amortisation) £119 for every £100 of revenue
⚽️Day to day losses £249m
⚽️Player purchases £745m
⚽️Player sales £203m
⚽️Borrowings in year £428m
Losses ⬆️ from £242m to £249m for day to day running of club but sale of hotel to another part of group, £30m of financial settlements & player sales ⬇️ this to £90m
Chelsea have cash in bank, total losses adding all the years together now £1.135 billion
Whilst #Rovers 🔑 revenue streams, matchday, broadcast & commercial all ⬆️ significantly. However general overheads ⬆️ too which meant no change to op losses. Sale of Armstrong in 21/22 halved losses
Both accounts & audit report reference that there is a material uncertainty over ability of club to trade as a going concern. Should no noted that audit report dated December 2023 & things may have improved since then
Burnley publish 22/23 accounts; 🔑 figs
Revenue £65m ⬇️ 47%
Wages £54m ⬇️ 42%
Loss pre player sales £41m
Player purchases £84m
Player sales £21m
Borrowings £101m
Big change in pre tax profit of £36m in 21/22 to a loss of £36m in 22/23. Mainly due to ⬇️ in revenue following relegation and player sale profits ⬇️ from £54m to £11m.
Burnley still have substantial cash but this due to the Club borrowing substantial amounts during the year as liabilities ⬆️. Burnley still profitable over the years.