Kieran Maguire Profile picture
Aug 9, 2021 15 tweets 9 min read Read on X
Premier League total income for 2019/20 down £633 million compared to previous season as Covid impact from March onwards. Gap between G6 and Other 14 average narrowed from £345m to £303m, which may 'justify' (in their own minds only) Project Big Powergrab & SuperLeague Franchise
EPL matchday income down 14% due to lockdown impact. Manchester United knocked off their perch for first time in EPL history by Spurs, who went from 4th to 1st. G6 clubs had 73% of matchday income, due to bigger stadia & more matches due to UEFA participation.
EPL broadcast income down £703m. Noticeable that Arsenal earned less than Sheffield United, a sign of a club clinging onto its 'Big Six' status?
Commercial income least affected of the three main tiers in EPL in 19/20 as increased by £175m. G6 clubs had 77% of the total.
As a result broadcast revenue fell from 59% to 51% of total income in 2019/20. Expect to bounce back in 2020/21 as more matches shown in the accounting year periods and rebates less severe.
PL wages £3.25 billion in 2019/20, compared to £3.12bn previous season. Would be higher as many contracts performance related & bonuses not paid by 30 June due to lockdown and season not finishing by that date. Mean weekly wage up 3,118% since start of EPL.
Amortisation (transfer fees spread over contract life) £1.37bn in 2019/20 up 6% on previous season. Manchester City leapfrog Chelsea and Manchester United to top the table. Spurs perhaps punching above their weight? Overall wages & amortisation 101% of total income in 19/20.
Profit can be defined in many ways by those wacky accountants. EBIT (operating profit pre-finance costs and excluding player sales and one-off items) was £1.26bn in 2019/20, up from £395m the previous season. Only two clubs made a prpfit compared to 7 in 18/19
EBITDA profit excludes player amortisation & infrastructure depreciation. Some like it as better indicator of 'cash' profit from day to day activities. Clubs went from £1.06bn profit in 18/19 to £209m in 19/20.
Losses can be mitigated by player sales. These totalled £542m in 19/20 compared to £434m the previous season, mainly due to Chelsea selling Hazard.
After taking into account player sales and finance costs on borrowings, EPL clubs overall made a £993m pre-tax loss in 2019/20 compared to £155m in 2018/19. Covid impact will be felt in 2020/21 too.
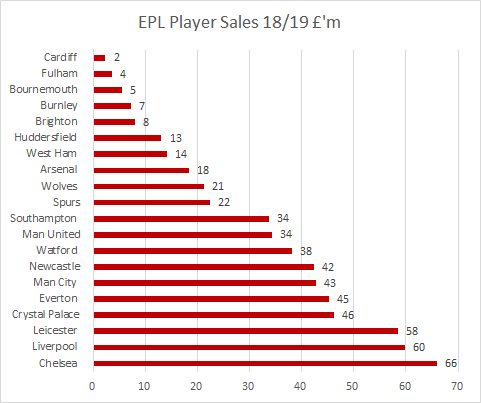
Player trading: May surprise Arsenal fans but they were the biggest spenders in 2019/20. Total player purchases £1,601bn compared to £1,867m the previous season. Chelsea top the player sales charts for fifth season in a row.
Total cost of squads at end of 19/20 was £7,428,000,000, up £691m on previous summer. Manchester City could have the first £1bn squad cost following purchase of Jack Grealish.
Football Net Debt, defined by UEFA as borrowings plus player transfer creditors less cash less football transfer debtors, was £4.17 billion at end of 19/20. Some loans are from owners and considered 'soft' with zero interest and no demand for repayment (eg Abramovich & Bloom)

• • •

Missing some Tweet in this thread? You can try to force a refresh
 

Keep Current with Kieran Maguire

Kieran Maguire Profile picture

Stay in touch and get notified when new unrolls are available from this author!

Read all threads

This Thread may be Removed Anytime!

PDF

Twitter may remove this content at anytime! Save it as PDF for later use!

Try unrolling a thread yourself!

how to unroll video
  1. Follow @ThreadReaderApp to mention us!

  2. From a Twitter thread mention us with a keyword "unroll"
@threadreaderapp unroll

Practice here first or read more on our help page!

More from @KieranMaguire

Apr 13
Chelsea FC Holdings submit 22/23 accounts. 🔑 figs
⚽️Revenue £512m ⬆️ 6%
⚽️Wages £404m ⬆️ 18%
⚽️Player costs (wages & amortisation) £119 for every £100 of revenue
⚽️Day to day losses £249m
⚽️Player purchases £745m
⚽️Player sales £203m
⚽️Borrowings in year £428m
Losses ⬆️ from £242m to £249m for day to day running of club but sale of hotel to another part of group, £30m of financial settlements & player sales ⬇️ this to £90m Image
Chelsea have cash in bank, total losses adding all the years together now £1.135 billion Image
Read 11 tweets
Apr 9
Blackburn submit 2023 accounts 🔑 figs
⚽️Revenue £21m ⬆️ 26%
⚽️Wages £26m ⬆️ 6%
⚽️Operating loss £21m ⬇️3%
⚽️Player purchases £4.8m
⚽️Player sales £0.35m
⚽️Borrowings £141m
Whilst #Rovers 🔑 revenue streams, matchday, broadcast & commercial all ⬆️ significantly. However general overheads ⬆️ too which meant no change to op losses. Sale of Armstrong in 21/22 halved losses
Image
Image
Both accounts & audit report reference that there is a material uncertainty over ability of club to trade as a going concern. Should no noted that audit report dated December 2023 & things may have improved since then
Image
Image
Read 10 tweets
Apr 2
Burnley publish 22/23 accounts; 🔑 figs
Revenue £65m ⬇️ 47%
Wages £54m ⬇️ 42%
Loss pre player sales £41m
Player purchases £84m
Player sales £21m
Borrowings £101m
Big change in pre tax profit of £36m in 21/22 to a loss of £36m in 22/23. Mainly due to ⬇️ in revenue following relegation and player sale profits ⬇️ from £54m to £11m. Image
Burnley still have substantial cash but this due to the Club borrowing substantial amounts during the year as liabilities ⬆️. Burnley still profitable over the years. Image
Read 11 tweets
Apr 2
Leicester announce 22/23 accounts for 13 months to 30 June. 🔑 figs
Revenue £177m ⬇️ 17%
Wages £206m ⬆️ 13%
Loss pre player sales £152m ⬆️ 91%
Player sale profits £75m
Player purchases £53m
Player sales £104m
Extending financial year from 31 May to 30 June allowed Leicester to squeeze in sales of Maddison but pre tax loss (start point for PSR) still £90m. Image
Leicester total losses over the years now £295m. Liabilities ⬇️ after owner converted loans into shares. Image
Read 8 tweets
Mar 31
Everton publish 22/23 accounts: 🔑 figs
Revenue £172m ⬇️ 5%
Wages £159m ⬇️ 2%
Amortisation £77m ⬆️ 23%
Manager/coaching payoff £7m
Executive payoff £2.5m
Loss pre player sales £130m
Pre tax loss £89m
Player signings £91m
Player sales £61m
Borrowings £341m
Losses ⬆️ due to no longer having Usmanov sponsor deals, wage ⬇️ modest & interest costs doubling Image
Cash balance down as club dealing with significant monthly demands in terms of meeting payroll and new stadium costs. Total losses over the years now £550m Image
Read 12 tweets
Feb 2
Stoke City financial summary. 🔑figures
⚽️Income £31m (no change)
🎟️Matchday £5m (⬇️10%)
⚽️ Wages £30m (⬇️19%)
⚽️ Operating losses £27m (⬇️7%)
⚽️ Player sales £16m
⚽️ Player purchases £3m
⚽️ Squad cost £20m (⬇️71m) Image
Total income static, but about a quarter of when Stoke were in PL. Stoke earned more than any other non-parachute payment club, mainly due to lucrative sponsor/commercial deals. Champ figs 21/22 unless says otherwise
Image
Image
Ticket sale income ⬇️10% despite crowds staying reasonably static at 20k. Lowest for a non-covid season for over a decade.
Image
Image
Read 11 tweets

Did Thread Reader help you today?

Support us! We are indie developers!


This site is made by just two indie developers on a laptop doing marketing, support and development! Read more about the story.

Become a Premium Member ($3/month or $30/year) and get exclusive features!

Become Premium

Don't want to be a Premium member but still want to support us?

Make a small donation by buying us coffee ($5) or help with server cost ($10)

Donate via Paypal

Or Donate anonymously using crypto!

Ethereum

0xfe58350B80634f60Fa6Dc149a72b4DFbc17D341E copy

Bitcoin

3ATGMxNzCUFzxpMCHL5sWSt4DVtS8UqXpi copy

Thank you for your support!

Follow Us!

:(