
For the first time, we’ve published data on
▪️ how safe adults aged 16+ feel walking alone in public settings
▪️ whether feeling unsafe has affected behaviours
▪️ experiences of harassment, such as catcalls, whistles and unwanted sexual comments
➡️ ow.ly/MCyD50FWQZ4
▪️ how safe adults aged 16+ feel walking alone in public settings
▪️ whether feeling unsafe has affected behaviours
▪️ experiences of harassment, such as catcalls, whistles and unwanted sexual comments
➡️ ow.ly/MCyD50FWQZ4
Two-thirds of women aged 16 to 34 years experienced one form of harassment in the previous 12 months:
▪️ 44% had experienced catcalls, whistles, unwanted sexual comments or jokes
▪️ 29% felt like they had been followed
➡️ ow.ly/CDC050FWR21
▪️ 44% had experienced catcalls, whistles, unwanted sexual comments or jokes
▪️ 29% felt like they had been followed
➡️ ow.ly/CDC050FWR21

When asked about walking alone after dark in a quiet street near home,
▪️ 1 in 2 women felt unsafe
▪️ 1 in 7 men felt unsafe
➡️ ow.ly/SDCC50FWR5C
▪️ 1 in 2 women felt unsafe
▪️ 1 in 7 men felt unsafe
➡️ ow.ly/SDCC50FWR5C
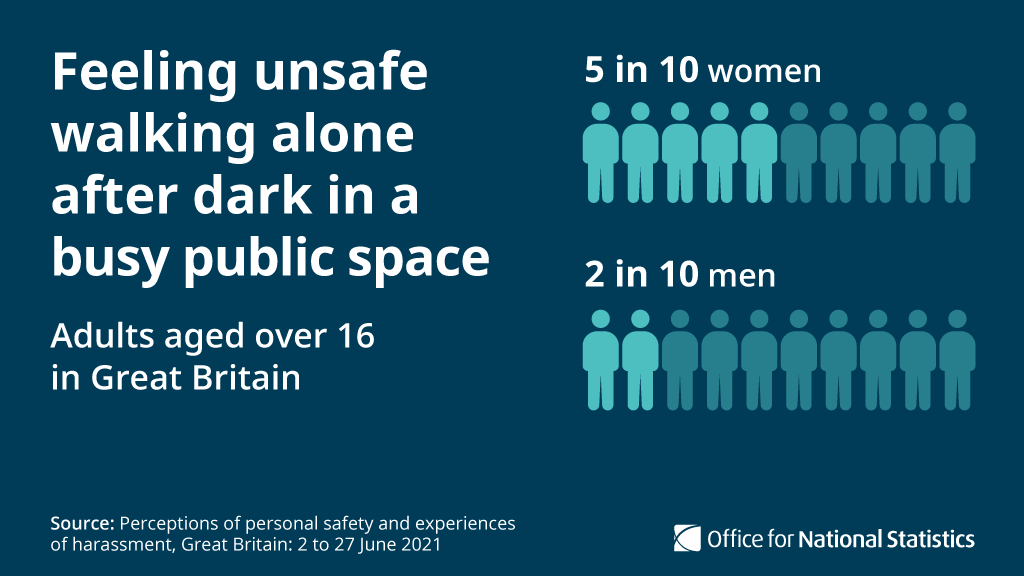
5 in 10 women felt unsafe walking alone after dark in a busy public space.
This is compared with 2 in 10 men who felt unsafe in these circumstances ow.ly/jD7i50FWR7H
This is compared with 2 in 10 men who felt unsafe in these circumstances ow.ly/jD7i50FWR7H
Twice as many women (8 in 10) felt unsafe walking alone after dark in a park or other open space compared with men (4 in 10 men) ow.ly/6XGB50FWRcP

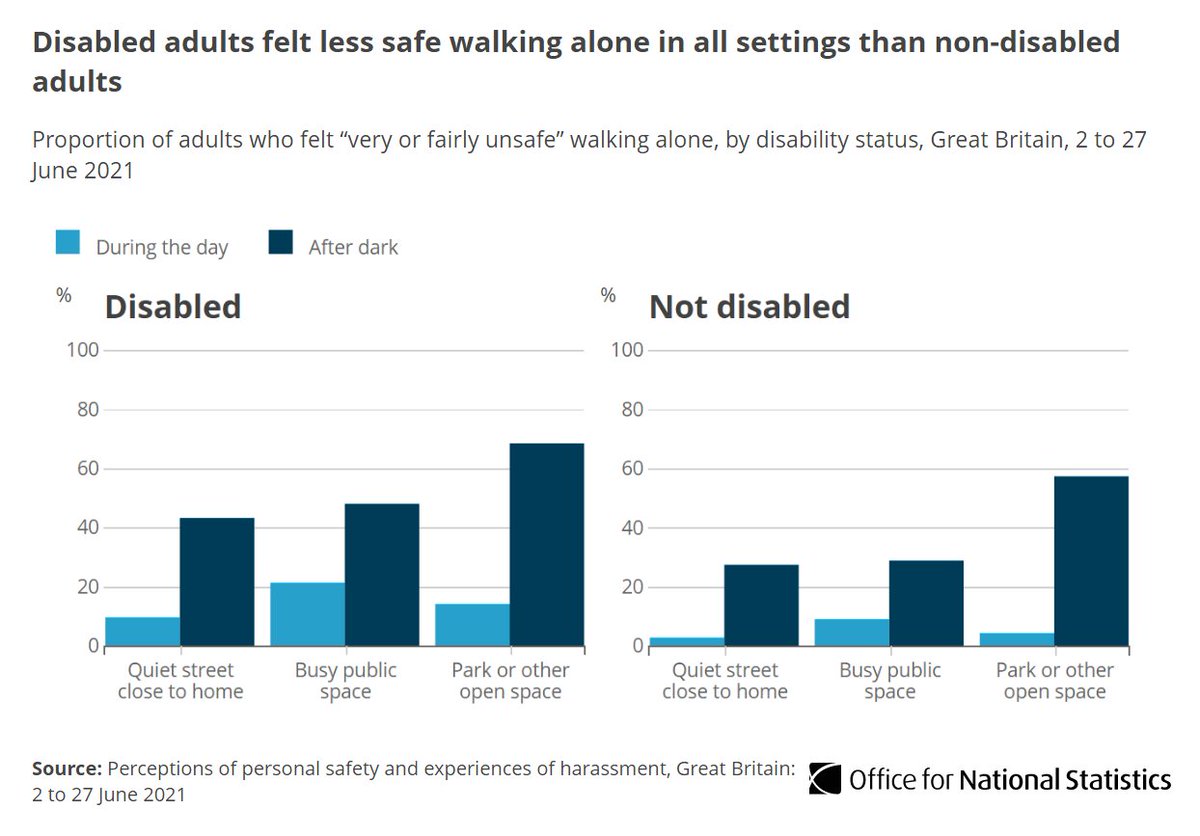
Disabled adults (including both physical and mental health conditions or illnesses) felt significantly less safe walking alone in all settings than non-disabled adults ow.ly/Uxau50FWRfr
• • •
Missing some Tweet in this thread? You can try to
force a refresh


