Thread
1/n
Australia ranks 6th in the world in the amount of forest area, with about 134 Mha (FAO 2020), after Russia, Brazil, Canada…, the countries where you might think forests really are, not in the dry Australian continent.
Keep reading if interested
1/n
Australia ranks 6th in the world in the amount of forest area, with about 134 Mha (FAO 2020), after Russia, Brazil, Canada…, the countries where you might think forests really are, not in the dry Australian continent.
Keep reading if interested

2/n
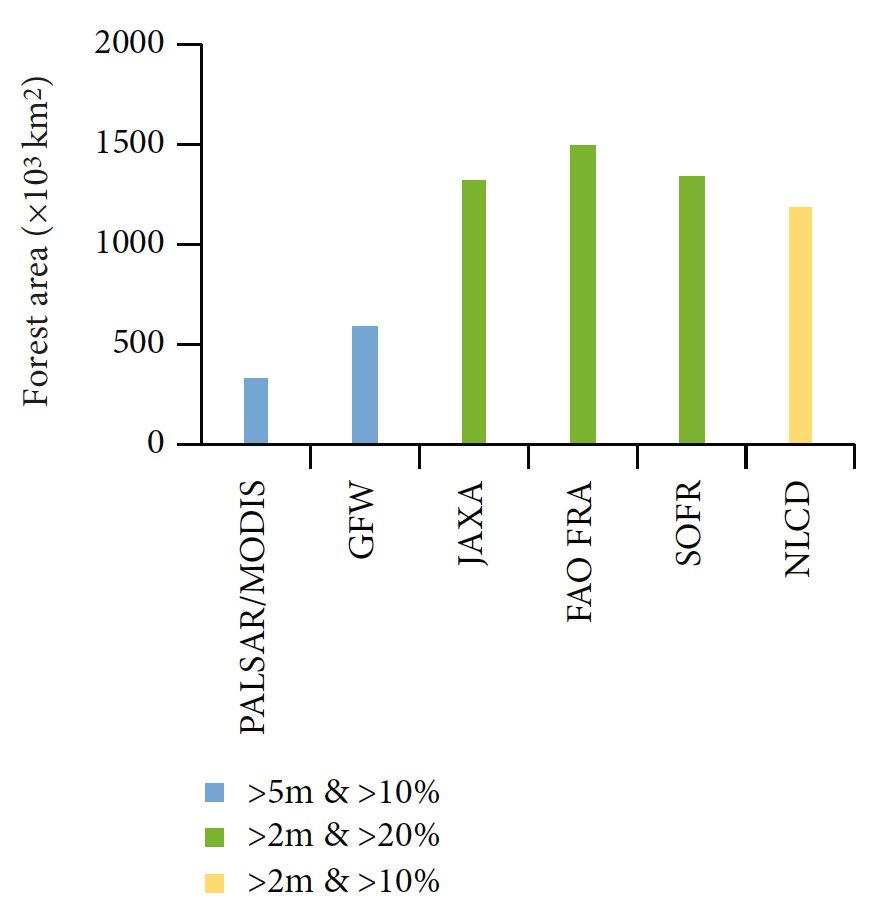
Although Australia does have extensive, diverse and beautiful forests, the very large area claimed is because of the decision by the Government to report forest extent based on forests equal or taller than 2 m, while the rest of the countries report on taller than 5 m.
Although Australia does have extensive, diverse and beautiful forests, the very large area claimed is because of the decision by the Government to report forest extent based on forests equal or taller than 2 m, while the rest of the countries report on taller than 5 m.
3/n
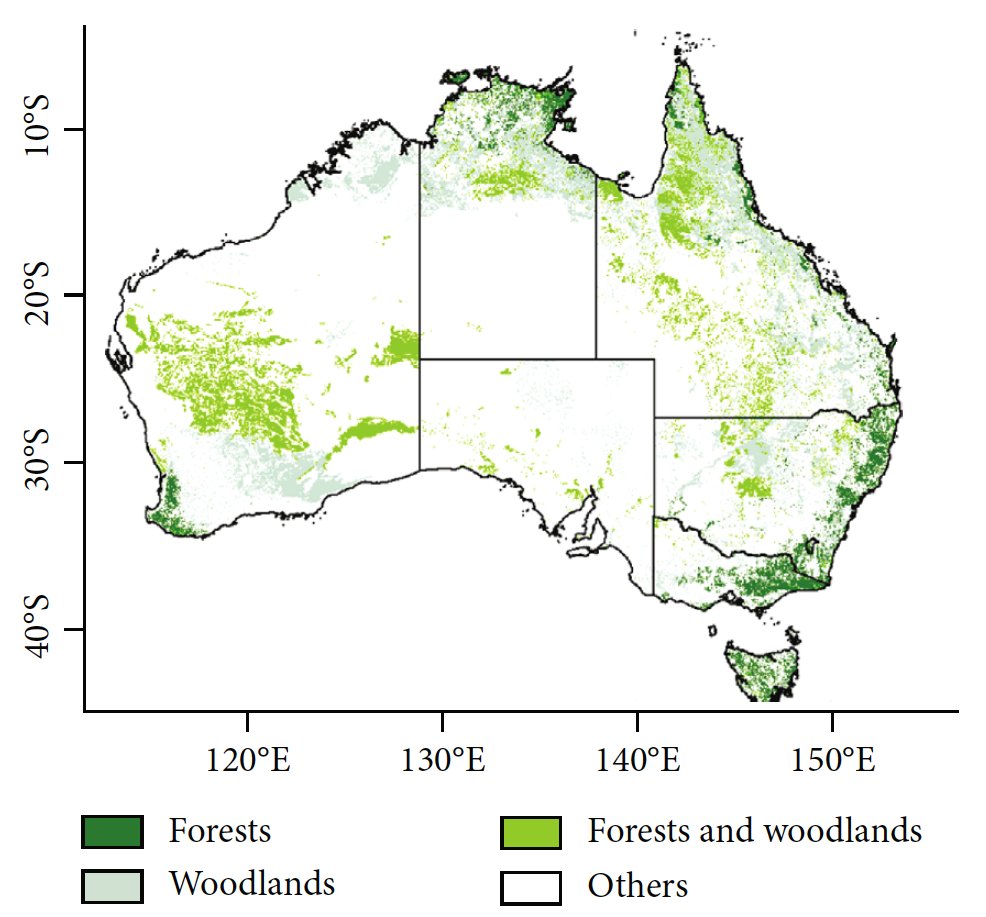
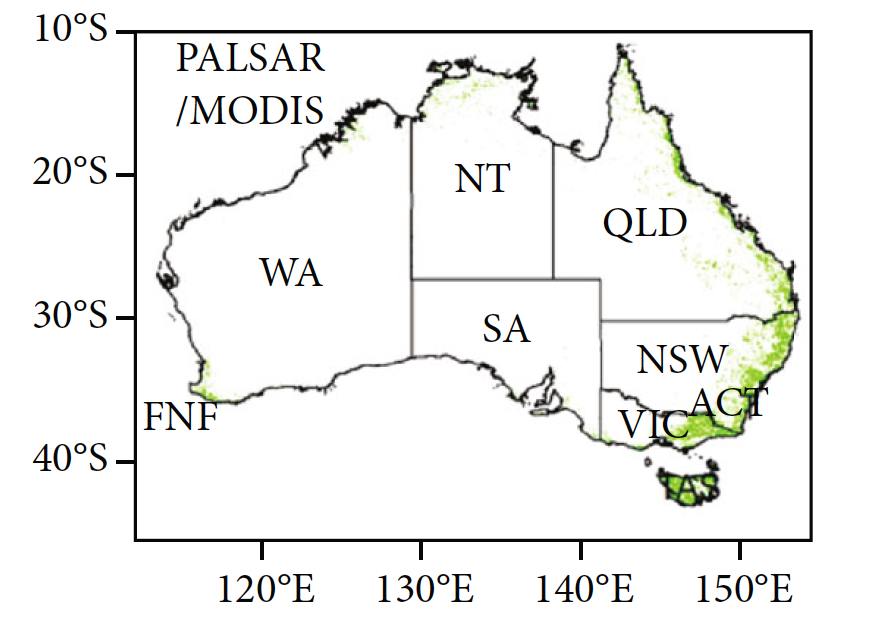
@qinyw_OU @XiangmingXiao @matin_brandt @ciais @pepcanadell ++ have produced a forest map based on radar (PALSAR) and optical (MODIS) data using 5 m height to have an extent more comparable with other countries.
@qinyw_OU @XiangmingXiao @matin_brandt @ciais @pepcanadell ++ have produced a forest map based on radar (PALSAR) and optical (MODIS) data using 5 m height to have an extent more comparable with other countries.
4/n
That gives an area of 32 Mha of forests for the year 2010, compared with 149 Mha reported by the Government.
See paper and data links:
bit.ly/3t6vbNv
That gives an area of 32 Mha of forests for the year 2010, compared with 149 Mha reported by the Government.
See paper and data links:
bit.ly/3t6vbNv
5/n
There are reasons for the choice of 2 m over 5 m, including perhaps that the FAO forest definition is a Northern Hemisphere view of what a forest should look like.
There are reasons for the choice of 2 m over 5 m, including perhaps that the FAO forest definition is a Northern Hemisphere view of what a forest should look like.
6/6
In the end, definitions need to serve their purpose in the first place (structure, function, biodiversity, resources).
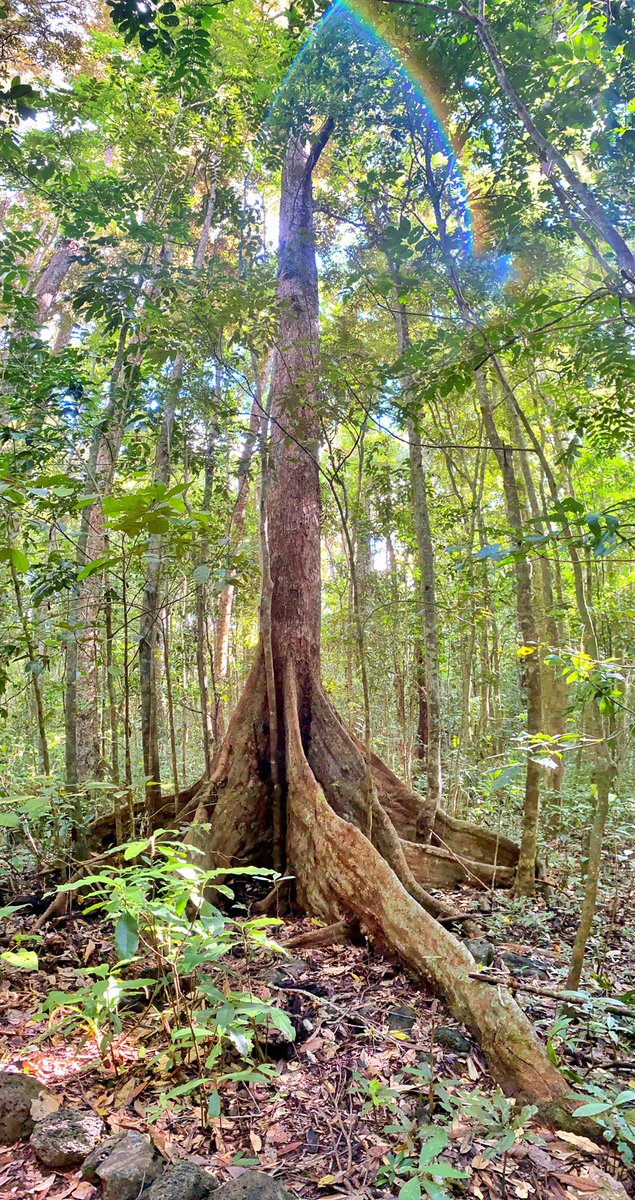
And regardless of the forest definition, even single trees outside of forests play an important role.
Paper:
nature.com/articles/s4159…
In the end, definitions need to serve their purpose in the first place (structure, function, biodiversity, resources).
And regardless of the forest definition, even single trees outside of forests play an important role.
Paper:
nature.com/articles/s4159…
And speaking of beautiful forests in Australia, the photo in the first tweet in this thread, here repeated, is from the Atherton Tablelands in Queensland.
• • •
Missing some Tweet in this thread? You can try to
force a refresh