Joel Profile picture
Sep 11, 2021 10 tweets 3 min read Read on X
Some conversations today have gotten me looking deeper into the "why" to complement the "what" that I see in the data. I will admit there will be big gaps in my understanding and interpretation of the literature but this from @GVDBossche resonates strongly when looking to explain
why COVID cases and deaths ubiquitously rise when mass vaccinations commence (but only when there is some virus already circulating). What @GVDBossche hypothesises as an expert scientist is exactly what we observe in the empirical data, i.e. bigger and more frequent unseasonal Image
waves as a result of mass vaccination in the middle of virus season. I maintain that the combination of empirical data and good science will eventually be accepted without dispute, though probably not for another couple of years. Many more lives will be lost unnecessarily.
Indeed, the worst is yet to come for the world-leading vaccinating countries. Image
My gut has told me to naturally steer clear of society this year (I think I might even have tweeted that for the first time I am concerned about COVID). But, not COVID-19, vax-COVID. Seriously, the vaxxed have nothing to fear from me, I won't be going anywhere near them.
Image
Image
Image
Image

• • •

Missing some Tweet in this thread? You can try to force a refresh
 

Keep Current with Joel

Joel Profile picture

Stay in touch and get notified when new unrolls are available from this author!

Read all threads

This Thread may be Removed Anytime!

PDF

Twitter may remove this content at anytime! Save it as PDF for later use!

Try unrolling a thread yourself!

how to unroll video
  1. Follow @ThreadReaderApp to mention us!

  2. From a Twitter thread mention us with a keyword "unroll"
@threadreaderapp unroll

Practice here first or read more on our help page!

More from @RealJoelSmalley

Sep 14, 2021
1/. According to official data, more unvaccinated people died of/with COVID in England in the first 5 months of 2021 than vaccinated. However, as is clearly seen in this chart, this is simply because more people were unvaccinated while COVID was circulating. Image
The rate at which the vaccinated (with at least one dose) replace the unvaccinated is exactly consistent with the vaccination rate.
2/. Almost all excess death during the period can be attributed to COVID. There are, however, 3 relatively small periods of apparent non-COVID excess. These could be due to data inconsistency (see N.B. at end), other respiratory pathogens or some other factor. Image
Read 10 tweets
Aug 19, 2021
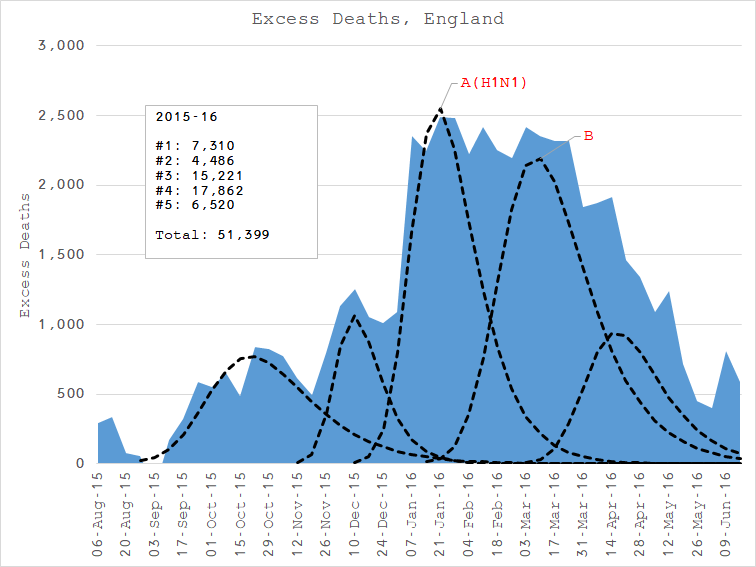
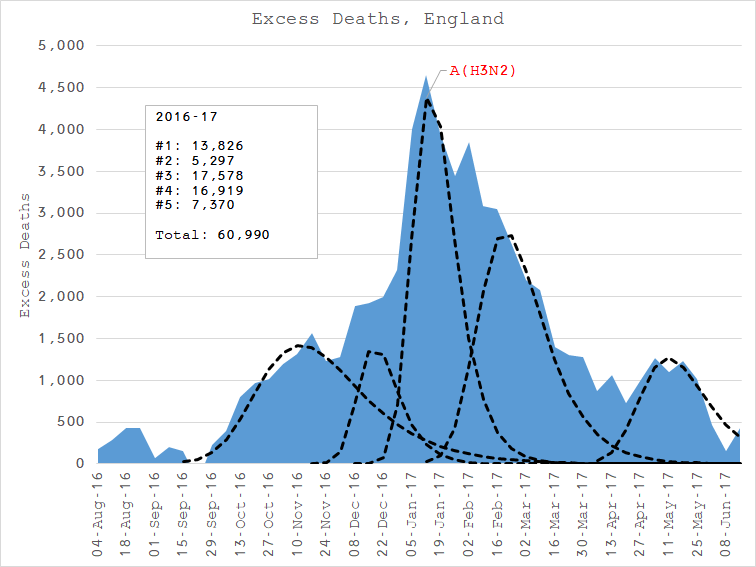
A seven-year mortality analysis of England and the story of how the UK govt turned an ordinary "flu" into the worst medical and political catastrophe in history.
Every year there is excess seasonal mortality. It is attributed to the dominant flu strain. In 2014-15, "A(H3N2)" accounted for 43k deaths. In 2017-18, with "B", it accounted for 57k. ImageImageImageImage
After a particularly soft 2018-19, in Feb-20, a novel virus - SARS-CoV-2 - emerged in the virome. The disease, COVID-19, unaffected by interventions which came too late in addition to being completely ineffective, accounted for 37k deaths, less than "A(H3N2)" 6 years before. ImageImage
Read 8 tweets

Did Thread Reader help you today?

Support us! We are indie developers!


This site is made by just two indie developers on a laptop doing marketing, support and development! Read more about the story.

Become a Premium Member ($3/month or $30/year) and get exclusive features!

Become Premium

Don't want to be a Premium member but still want to support us?

Make a small donation by buying us coffee ($5) or help with server cost ($10)

Donate via Paypal

Or Donate anonymously using crypto!

Ethereum

0xfe58350B80634f60Fa6Dc149a72b4DFbc17D341E copy

Bitcoin

3ATGMxNzCUFzxpMCHL5sWSt4DVtS8UqXpi copy

Thank you for your support!

Follow Us!

:(