The BBB Series – Topic 7: Part 2 – Exploring Other Swap Types
Here we will take a brief look at a few other swap types that have been mentioned in this series so far, as well as some swap types you might read about in news/fintwit.
Here we will take a brief look at a few other swap types that have been mentioned in this series so far, as well as some swap types you might read about in news/fintwit.
Again, we will not go too deep into each of them but more so focus on building the right intuition behind each of them – reasoning trumps rote.
OIS
Let’s begin with the very first swap ever mentioned in this series – the Overnight Indexed Swap (OIS).
As I mentioned in Part 1 – a USD OIS is typically referencing Fed Funds Effective Rate (EFFR). Here is what a 6 month USD OIS looks like:
Let’s begin with the very first swap ever mentioned in this series – the Overnight Indexed Swap (OIS).
As I mentioned in Part 1 – a USD OIS is typically referencing Fed Funds Effective Rate (EFFR). Here is what a 6 month USD OIS looks like:

Notice the same 6 parts of a swap: fixed/float legs, DC stripping, NPVs and premium. No different than a vanilla 3ML IRS. The difference is the Index here is on EFFR which resets everyday and the payout frequency.
The overnight in OIS comes from the reference rate, not the term of the swap. In this example the swap maturity is 6M with an annual (i.e. 1 time) payout.
Hence, any overnight rate can be used in OIS – EONIA (Europe), SONIA (UK) and going forward SOFR, ESTR and TONAR(Japan).
Hence, any overnight rate can be used in OIS – EONIA (Europe), SONIA (UK) and going forward SOFR, ESTR and TONAR(Japan).
Notice that resets are daily (overnight) and the cashflow payout is 1 single time with no exchange of principal.
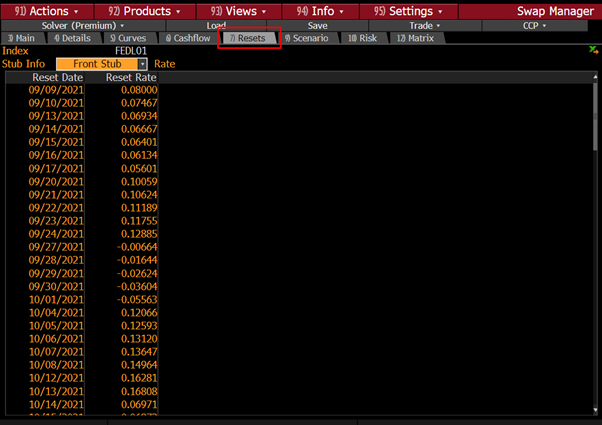

If we apply our concept of swap risk from Part 1 to here we can imagine that PnL on the swap will change if the EFFR does not stay at 0.08%.
Thus, OIS is one way for a trader to bet on fed policy direction. That simple! Done. Next!
Thus, OIS is one way for a trader to bet on fed policy direction. That simple! Done. Next!
ASSET SWAPS
We introduced ASW back in the Topic 5 on Credit but with our newfound appreciation for IRS hopefully this makes more sense.
We introduced ASW back in the Topic 5 on Credit but with our newfound appreciation for IRS hopefully this makes more sense.
https://twitter.com/EffMktHype/status/1425749542289371140
First of all, the name implies you are swapping an asset for another cashflow. So let’s assume you’re a bank and a client sells 1MM of a 7y AAPL bond to you.
You now have this bond on your books and let’s assume you’re magically able to hold it in inventory (lololol)
You now have this bond on your books and let’s assume you’re magically able to hold it in inventory (lololol)
As a bank, you want floating cashflows not fixed so you swap it – what is the fair value to swap it? Well, let’s build a swap from scratch.
1. Today is 9/7/21, settlement is T+2
2. Bond pays 1.4% coupon, S/A, 30/360
3. Accrual date starting on 08/05/21
4. Matures on 08/05/28
1. Today is 9/7/21, settlement is T+2
2. Bond pays 1.4% coupon, S/A, 30/360
3. Accrual date starting on 08/05/21
4. Matures on 08/05/28

Plug that into a plain vanilla IRS on SWPM:

Notice the premium is -1.66746 while you are paying fixed. This means that you are overpaying at 1.4% versus what the 3M LIBOR curve implies you will receive in floating cashflows, resulting in a negative NPV for you.
Remember swaps are about equivalence!
Remember swaps are about equivalence!
Now you’re swapping a bond’s coupon so you can’t change the 1.4%. You also can’t change what the 3M LIBOR curve is trading at either. So what can you change to achieve value equivalence?
The spread on the floating leg.
The spread on the floating leg.
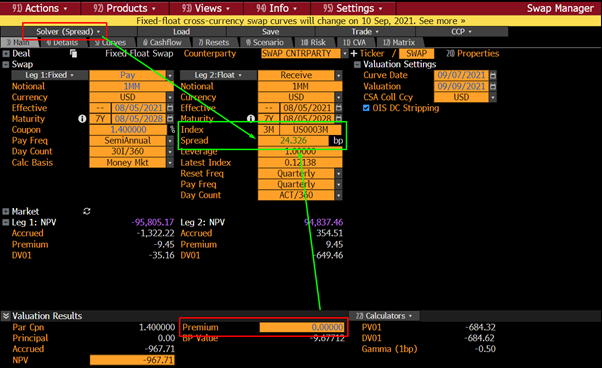
So at a premium of 0, the spread over LIBOR should be 24.326bps.
Are we good here? No.
Are we good here? No.
Why? Because if you think about it, we’re basically pricing a par swap (premium = 0). But in an asset swap I am swapping the cashflows from a bond I bought in the market.
Did I buy this AAPL bond at 100? In this case…no.
Did I buy this AAPL bond at 100? In this case…no.
Let’s say on 9/7 we bought it at 99.591, meanwhile I swap out the cashflows into a par swap (value of 100) – which means I’m buying cheaper and selling for a PREMIUM. Remember how swaps are about value equivalence? So the premium in this case is 100 - 99.591 = 0.409 in my favour.

If I take the 0.409 premium and plug it into the SWPM calculator (remember I am paying fixed but owe the premium to my counterparty to make it fair) this is what it calculates the spread on floating leg to be: 30.293

Given the same valuation date ASW returns 30.325bps which is very close but not the same as what we manually built in SWPM.

The reason is simple – cashflow dates. SWPM by default will assume swap convention dates and adjustments whereas ASW must follow the bond’s cashflow schedule.
The same on the float leg which on swap conventions modifies for biz dates. Once you adjust cashflows – ASW will match.
The same on the float leg which on swap conventions modifies for biz dates. Once you adjust cashflows – ASW will match.


Tip: to quickly adjust – drag with your mouse until a dotted white box appears on bbg, anything inside is copied. Paste into Excel. Then drag the highlighted dataset in Excel into the first box of SWPM to paste the bond’s cashflow dates.

Tadah! Magic baby!!!


Note that this is what is termed a Par-Par Asset Swap, where the bond’s premium is factored in as a result of pricing the fixed leg at par.
This is the most common form however you can also swap at market value rather than par, in which case the Spread changes.
This is the most common form however you can also swap at market value rather than par, in which case the Spread changes.
What does ASW mean?
Think of ASW as a Bond + IRS. You buy a bond for 99.591 and then proceed to swap its cashflows. The credit risk of the bond is captured in its cashflows, which you are swapping at par.
Think of ASW as a Bond + IRS. You buy a bond for 99.591 and then proceed to swap its cashflows. The credit risk of the bond is captured in its cashflows, which you are swapping at par.
After compensating for the bond premium/discount, that credit risk must now be captured in the floating leg to achieve equivalence in the swap. This is why ASW is looked at as a measure of a bond’s credit risk over the swaps curve.
TOTAL RETURN SWAPS
Total return swaps are simply a way to gain exposure to the total return performance of an asset in exchange (swapping) for typically a floating rate cashflow.
Total return swaps are simply a way to gain exposure to the total return performance of an asset in exchange (swapping) for typically a floating rate cashflow.
For example, if my financing cost is typically LIBOR+75bps then to borrow 1MM from my broker to purchase equities while 3M LIBOR is 0.11575% I would have to pay (0.86575%/4)*1MM = $2,164 in margin financing a quarter.
The benefit of TRS is that like most swaps, you do not have to exchange notionals nor actually own the underlying asset.
Years ago, when I was on a prime brokerage desk as an intern one fairly large client was doing TRS on KOSPI.
Years ago, when I was on a prime brokerage desk as an intern one fairly large client was doing TRS on KOSPI.
Why? Because to invest directly you need a local account and register with local regulators/authorities.
TRS instead allows for synthetic exposure to an asset.
TRS instead allows for synthetic exposure to an asset.
With TRS you are able to utilize your counterparty’s balance sheet by effectively leasing the asset and paying a borrowing fee for it.
This allows for significant leveraged exposure to an asset’s performance – the latest famous example was Archegos who was doing exactly this
This allows for significant leveraged exposure to an asset’s performance – the latest famous example was Archegos who was doing exactly this
In this example you are receiving the performance of KOSPI on a quarterly basis (capital gains plus dividends, in USD) while paying LIBOR+75.


If started in March you would have money in the first quarter net of LIBOR+75 and in the current quarter you would be losing money on the KOSPI and paying LIBOR+75 on top of that.

Unlike a fixed/float swap, an equity TRS doesn't require you to imply forward the floating leg rates. It is simply marking each current quarter’s performance against a financing rate (that floats). You can do TRS on any instrument, not just equities and many do for bonds as well.
BASIS SWAPS
With basis swaps we move away from the vanilla IRS where it was fixed cashflows swapping to floating ones and now look at floating-to-floating swaps.
With basis swaps we move away from the vanilla IRS where it was fixed cashflows swapping to floating ones and now look at floating-to-floating swaps.
What is “basis”? For example, when hedging you are hoping to offset one asset for another and the difference between the two is known as the basis, or the source of an imperfect hedge. Basis is the gap between two instruments.
So in swaps, say I have a loan that I pay interest every 3 months but I have receipts that come in every 6 months – my loan payment can fluctuate twice as often as my receipts.
How do i hedge out this risk? By converting the 6M to 3M cashflows or vice versa.
How do i hedge out this risk? By converting the 6M to 3M cashflows or vice versa.
Remember how we talked about how time increases risk in many forms? Credit risk, reinvestment risk, etc. And 3M difference might not seem long but in times of stress it makes all the difference (imagine lending money to Merrill for an additional 3M just after Lehman fell).
So by that logic, the shorter the time frame, the “safer” the investment, but that is only HALF the story of certainty. Let’s look at swapping 3M LIBOR and 6M LIBOR without any spread added.
The math here is exactly the same as in the vanilla IRS’ floating leg.
The math here is exactly the same as in the vanilla IRS’ floating leg.

We are implying the cashflows forward at 3M and 6M intervals respectively using risky swap curves then discounting them to present value using the SOFR swaps curve.
First, here 3M has a lower rate than 6M. Second, just based on discounting of their implied cashflows the NPV for the 3M leg is lower, resulting in a negative premium for the 3M receiver.

Let’s stop to ask why. Why aren’t they the same? You have two options, fund for 3 months then roll into another 3mths of funding OR just fund once for 6mths.
Which has more certainty? The 6mth funding.
Which has more certainty? The 6mth funding.
TAKEAWAY: The guarantee of 6M funding today is more valuable than funding for 3M today and another 3M in 3M time. This is the other HALF of the story.
This logic applies across the curve. 3m funding is more valuable than 3x1m and 1m funding is more valuable than 30d O/N funding.
This logic applies across the curve. 3m funding is more valuable than 3x1m and 1m funding is more valuable than 30d O/N funding.
So in order to achieve value equivalence we must find the spread on top of 3M to make the NPVs equal. This spread, is a funding premium. If you want to swap shorter funding for longer guaranteed funding, you have to cough up a premium.
That is exactly what basis swaps are about.
That is exactly what basis swaps are about.
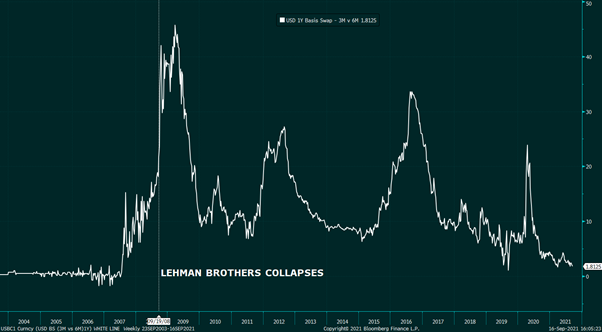
So for 1 year, if you were to swap 3M and 6M cashflows the 3M receiver should get 1.8bps extra each quarter to compensate for the higher value of paying the 6M leg.
If you look at contributed quotes on ICVS you’ll find the rate is pretty close.
If you look at contributed quotes on ICVS you’ll find the rate is pretty close.


Float/Float basis swaps are really about how the money market values the certainty of longer funding.
Note in the chart how that premium to receive 3v6 funding after Lehman collapsed skyrocketed while the excess supply of cash right now is why the basis is so low.
Note in the chart how that premium to receive 3v6 funding after Lehman collapsed skyrocketed while the excess supply of cash right now is why the basis is so low.

This idea of swapping one floating rate for another is key piece of the next and very popularly discussed type of swap: the Cross Currency Basis Swap (XCCY).
XCCY
The first thing I will say is that please get terminology correct – cross currency basis swaps and fx swaps are not the same thing. An FX swap is basically a FX Forward where you’ve also exchanged currencies at spot, locking in the exchange rate gain/loss. XCCY is different.
The first thing I will say is that please get terminology correct – cross currency basis swaps and fx swaps are not the same thing. An FX swap is basically a FX Forward where you’ve also exchanged currencies at spot, locking in the exchange rate gain/loss. XCCY is different.
Let’s first imagine I’m a French investor – 5pm in office is overtime and I see more strikes at work than the bowling alley. I also want to buy some US bonds but I only own Euros.
If I were to ask someone with USD to swap their USD with me for EUR I would have to pay him the USD rate while I would earn the EUR rate.
Right now, EUR rates are all negative so instead of earning on EUR I’m actually losing
Right now, EUR rates are all negative so instead of earning on EUR I’m actually losing

So already in a 1 year lending scenario I’m paying 0.1585 – (-0.490) = 0.6525% as a EUR holder looking for access to USD.
Under Covered Interest Rate Parity theory, for me to borrow the USD and invest it then at the same time lock in a forward rate to exchange the net proceeds back to EUR would be the same as if I had just invested my EUR domestically.
Most of the time it’s close to true. Most.
Most of the time it’s close to true. Most.
Let’s look at the XCCY: First we start with USD 3M LIBOR vs EUR 3M EURIBOR as a base example.
We assume neither have a spread on top, just like with the basis swap example.
We assume neither have a spread on top, just like with the basis swap example.

In this scenario the NPV of the EUR leg is worth more than the NPV of the USD leg resulting in a premium to the USD payer. Let’s dig into the cashflows to see what’s going on:
First the USD payer receives US$10MM then proceeds to pay quarterly LIBOR where using the swaps curve, the forward rates are implied. Then using a risk free curve the cashflows are discounted.

At the same time, they are receiving EUR interest on the other leg.
So they lend EUR8.45MM (FX = 1.18255) and receive implied forward 3M EURIBOR each quarter.
Note the cashflows are negative until maturity: they are paying on the receiving leg
So they lend EUR8.45MM (FX = 1.18255) and receive implied forward 3M EURIBOR each quarter.
Note the cashflows are negative until maturity: they are paying on the receiving leg

The Net effect is that the USD borrower pays USD interest, and then also pays EUR interest (because it’s negative).
For the first payment it goes like this:
USD Interest paid: -2,925.90
EUR Interest earned: -11,564.23 * 1.18465 = -13,699.56
Total Interest earned/paid: -16,625.45
Discount this by the USD DF and you get the PV.
USD Interest paid: -2,925.90
EUR Interest earned: -11,564.23 * 1.18465 = -13,699.56
Total Interest earned/paid: -16,625.45
Discount this by the USD DF and you get the PV.

So by now it’s clear that the value of a XCCY swap is affected by USD swap rates, EUR swap rates AND FX forward rates.
The FX portion is particularly important here because it is affected by the demand for foreign investors to hedge their USD investments.
The FX portion is particularly important here because it is affected by the demand for foreign investors to hedge their USD investments.
If the EUR lending rate was positive, it would mean the more he can negotiate a lower EUR borrowing rate.
This is why for a while (esp 2016), many negative yielding currencies saw their XCCY turn deeply negative when their domestic investors increased demand for USD.
This is also why with so much liquidity currently, there is little cost to access USD globally.
This is also why with so much liquidity currently, there is little cost to access USD globally.

1Y EURUSD XCCY went as deep as -48bps in 2016 implying that EUR holders were willing to pay higher and higher net interest in order to get USD.
At -48bps today a 1y swap valuation would imply a 2% discount on the swap for the USD borrower from the get go.
At -48bps today a 1y swap valuation would imply a 2% discount on the swap for the USD borrower from the get go.

This is a key instance in which value equivalence does not hold in financial markets and things like CIP cease to hold and why XCCY is commonly used as an indicator for foreign demand for USD (or any other currency).
So if you’re a USD holder and basis is deeply negative, how do you profit from this?
In march last year during the pandemic, JPY-USD basis dropped to -57bps while the US 1y rate also fell to 0.1654 as investors reached for safety and the dollar.
At the same time, a JGB with 1 y of maturity left (maturing March 2021) was trading at a yield of -0.22%
At the same time, a JGB with 1 y of maturity left (maturing March 2021) was trading at a yield of -0.22%
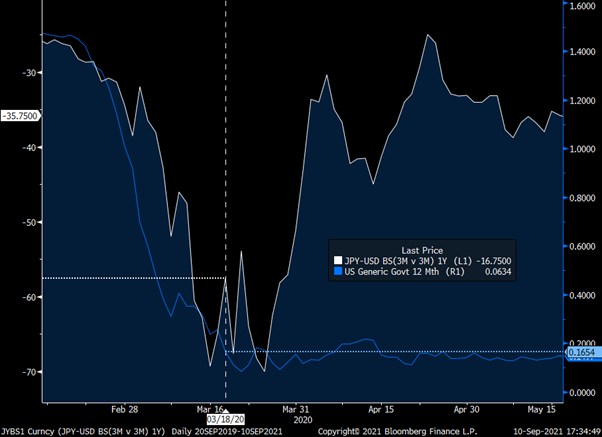
Because people wanted USD so badly, a USD based investor could theoretically have bought a JGB at -0.22% then swapped it back to USD over the next year.

If you click on the SWPM value at the top right you can see it structured as a swap – what we are doing now is combining the concept of an asset swap with the concept of cross currency basis swaps. Giddyup!
First, you buy the JGB then swap it so you are the Payer on leg 1 – the details of the bond are input, including its 1.3% coupon. In return, you swap it for a USD fixed coupon leg.
How do you arrive at this?
How do you arrive at this?

Well, you first match the cashflows timings of the JGB so there is no timing mismatch, then you solve for the USD fixed coupon given a set premium.

Premium is the premium over par that you pay for the JGB: 100 – 101.531 = -1.531 just like in ASW!
This means upfront you buy the JGB for 101.531 and get paid 1.53 back from the swap and proceed to earn 1.129% fixed on the USD leg when domestic 1y bills were yielding 0.1654%!
This means upfront you buy the JGB for 101.531 and get paid 1.53 back from the swap and proceed to earn 1.129% fixed on the USD leg when domestic 1y bills were yielding 0.1654%!

Note that in a market swap (i.e. premium is 0) then the fixed coupon will be even higher to compensate for the overpayment of the bond in return for a par swap.
If you want to quickly see XCCY then run XCCY<GO> to see the cross currency basis swaps around the world against a benchmark currency.
A quick calculator can be found on XCF<GO>
A quick calculator can be found on XCF<GO>


Some resources and articles on XCCY:
BIS on FX hedging impact on basis:
Hedged-JGBs for foreigners: https://t.co/0c3aI5s2zc
BOJ review on XCCY trends (2016): https://t.co/C08xvXJsHNbis.org/publ/qtrpdf/r_…
reuters.com/article/japan-…
bis.org/events/bissymp…
BIS on FX hedging impact on basis:
Hedged-JGBs for foreigners: https://t.co/0c3aI5s2zc
BOJ review on XCCY trends (2016): https://t.co/C08xvXJsHNbis.org/publ/qtrpdf/r_…
reuters.com/article/japan-…
bis.org/events/bissymp…
That is all that I will cover in swaps. There's a much deeper world out there that goes far beyond what I know or dare to look at. Hopefully this helps you start understanding how swaps are used and why they're instrumental in transforming and capturing changes in interest rates.
More than anything, I hope it gives you a bit more of an idea what all these smart people I follow are talking about!
Bonus question (courtesy of @shortendtrader):
At 11 am London time I buy $500m 1y usd 3s6s basis at 2.
1. What is my total delta at time of trade
2. What is my total delta at 11:55:01
1/2
At 11 am London time I buy $500m 1y usd 3s6s basis at 2.
1. What is my total delta at time of trade
2. What is my total delta at 11:55:01
1/2
3. Assuming I do no further trades in the day and economic data comes out strong at 1.30 causing yields to rise aggressively in the 1y sector, is my trade in the money, out of the money or unchanged and why.
Assume that 3ML and 6ML fix where you expect them to come in at.
2/2
Assume that 3ML and 6ML fix where you expect them to come in at.
2/2
• • •
Missing some Tweet in this thread? You can try to
force a refresh