34,526 new #covid19uk positive tests reported today (28-Sep). Another big day of England day-1 LFD positives although only slightly higher than previous Tuesday's. Waiting to see what tomorrow brings as usually the big post-weekend catchup day.
Animated chart to show LFD-only positives being either converted into PCR confirmed positives or removed due to negattive confirmation, over the last 14 days of reports.
Pivot table of daily changes to LFD Only and LFD Confirmed by PCR figures to see if we can identify where LFDs are now being removed due to negative follow-up PCRs.
Longer term view. 34,526 new #covid19uk positive tests reported today (28-Sep). This brings the rolling average by specimen date (allowing 4 days for lag) to 33,626, an increase of 5123 (18%) in the last week.
Closer look at the latest 45 days, with today's added numbers highlighted in yellow. Individual nations and animated England charts further down the thread.
Separate charts for England (28808) Scotland (2370) Wales (2270) and Northern Ireland (1078). Note the different scales. Also on certain days the specimen-date data for Scotland/Wales/NI doesn't get updated so the yellow bars may be mising or include multiple day's numbers.
Animated chart to show how the #covid19uk positive tests by specimen date have been contributed to by reports over the last 7 days. Note this just includes England numbers as other nations don't always publish their specimen date numbers every day.
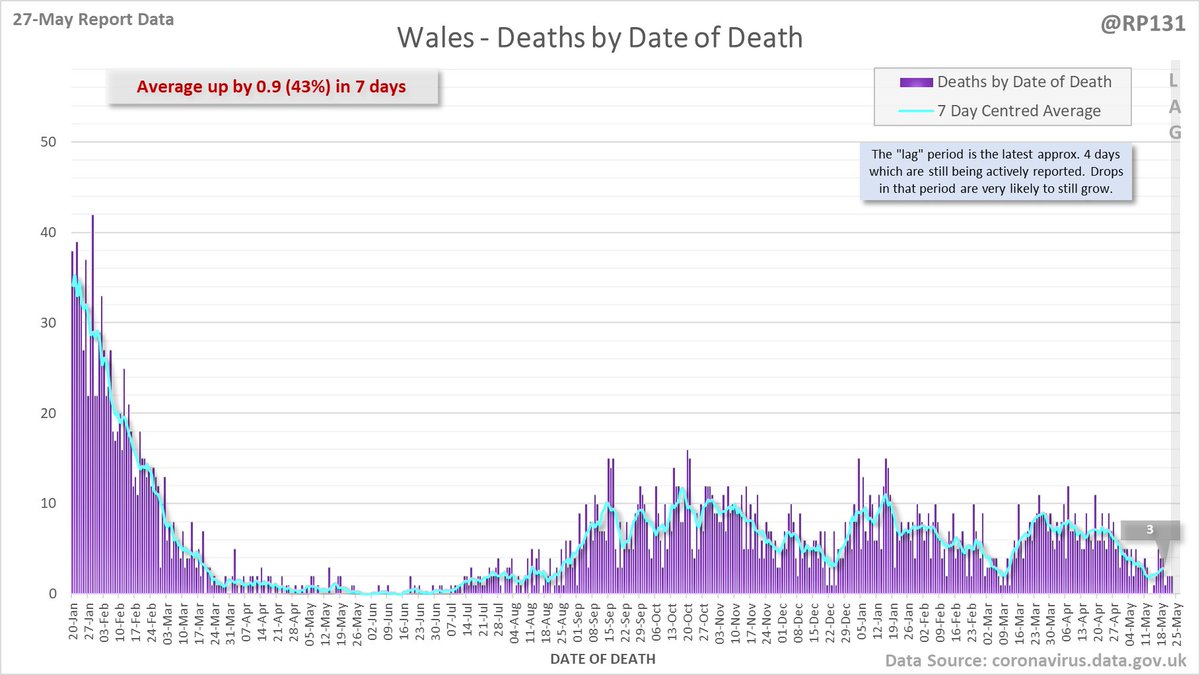
61 new #covid19uk deaths reported today (27-May). This brings the rolling average by date of death (allowing 4 days for lag) to 70, equivalent to around 21-Jul (i.e. 303 days ago), a reduction of 34 (33%) in the last week.
Closer look at the latest 45 days, with today's added numbers highlighted in orange. Individual nations and animated England charts further down the thread.
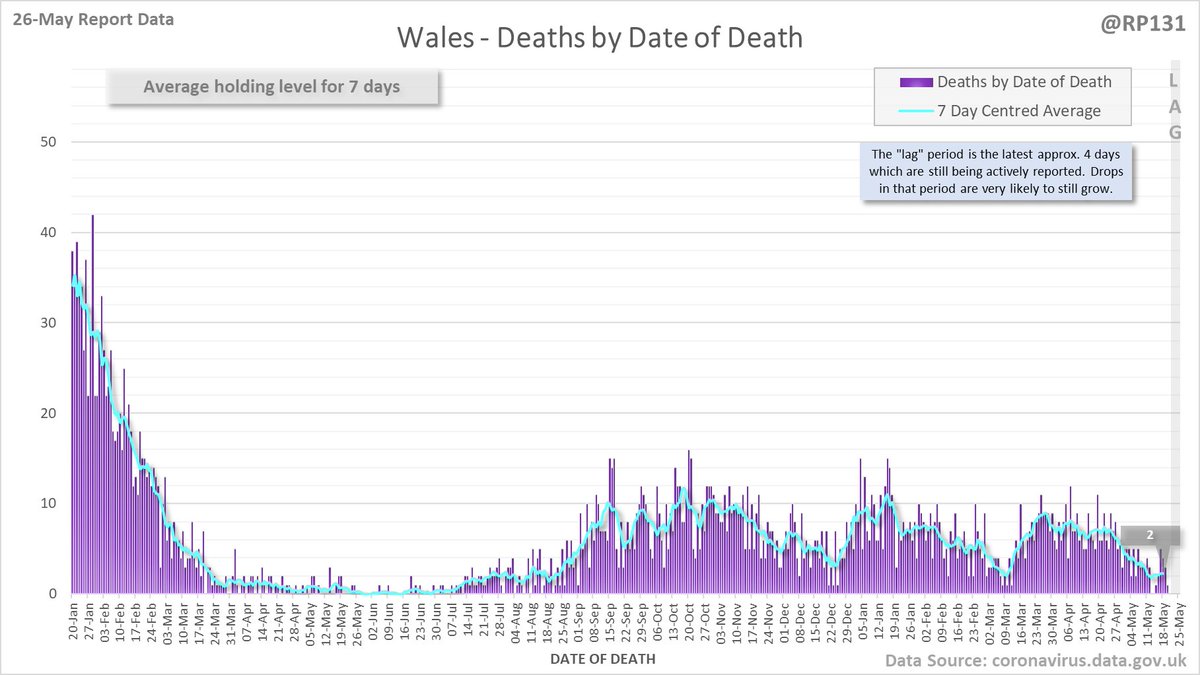
Longer term charts for England, Scotland, Wales and Northern Ireland.
4,661 new #covid19uk positive tests reported today (27-May).
Overall England is DOWN 22% on previous Friday and day-1 lateral flow positives are also down by 19%.
England's rolling average by specimen date has now been dropping since the 21st of March (67 days ago).
Chart to show England positive tests (as of 27-May) by breakdown of first infection events and possible reinfection events.
Possible reinfections were added to the data from 31-Jan and the rolling average vs. total tests is currently about 17%.
Longer term view. 4,661 new #covid19uk positive tests reported today (27-May). This brings the rolling average by specimen date (allowing 4 days for lag) to 6,958, equivalent to around 08-Jun (i.e. 346 days ago), a reduction of 1268 (15%) in the last week.
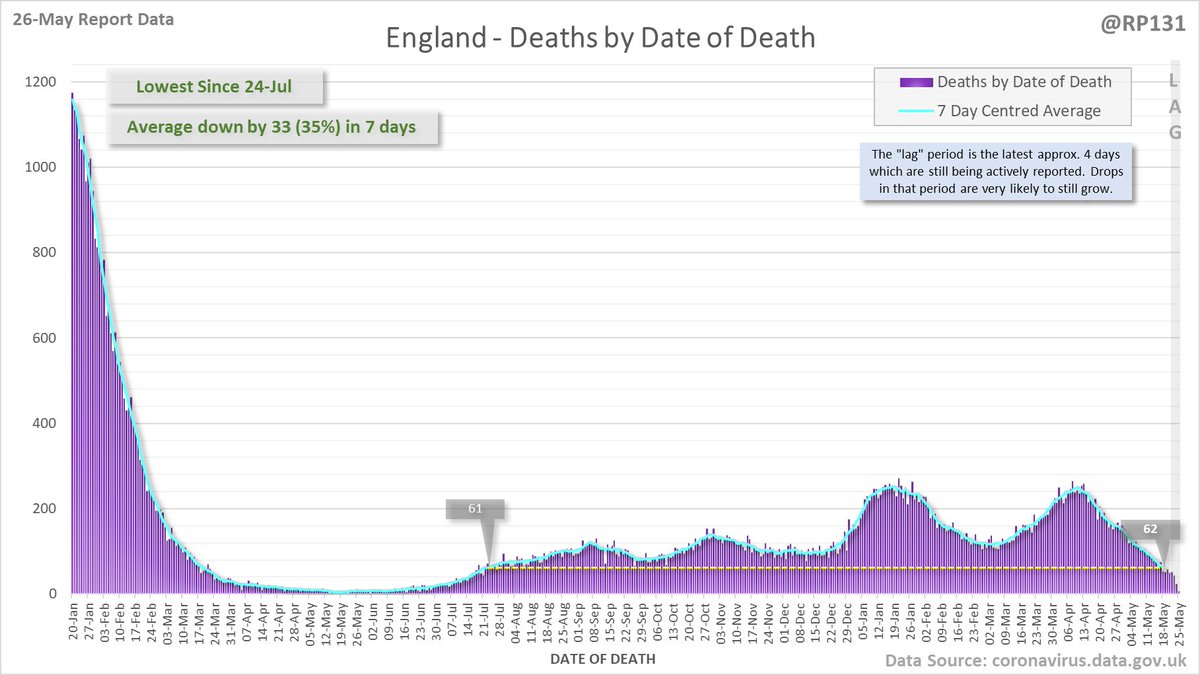
91 new #covid19uk deaths reported today (26-May). This brings the rolling average by date of death (allowing 4 days for lag) to 71, equivalent to around 24-Jul (i.e. 299 days ago), a reduction of 35 (33%) in the last week.
Closer look at the latest 45 days, with today's added numbers highlighted in orange. Individual nations and animated England charts further down the thread.
Longer term charts for England, Scotland, Wales and Northern Ireland.
8,369 new #covid19uk positive tests reported today (26-May).
Overall England is DOWN 21% on previous Thursday and day-1 lateral flow positives are also down by 16%.
England's rolling average by specimen date has now been dropping since the 21st of March (66 days ago).
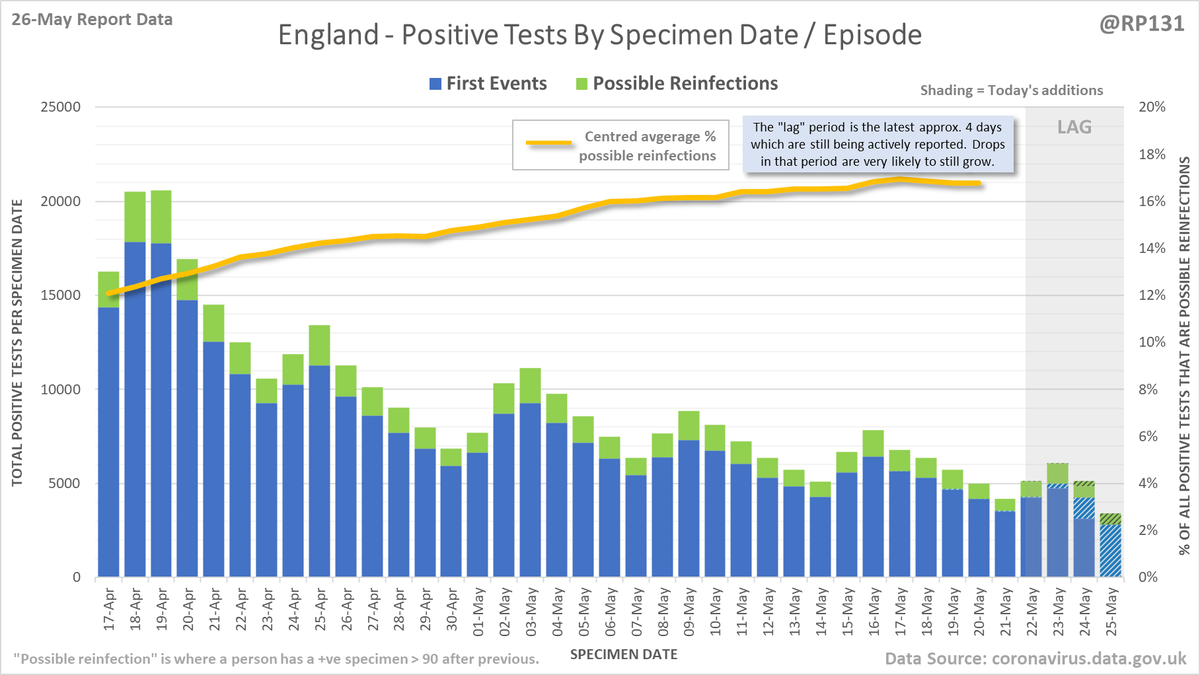
Chart to show England positive tests (as of 26-May) by breakdown of first infection events and possible reinfection events.
Possible reinfections were added to the data from 31-Jan and the rolling average vs. total tests is currently about 17%.
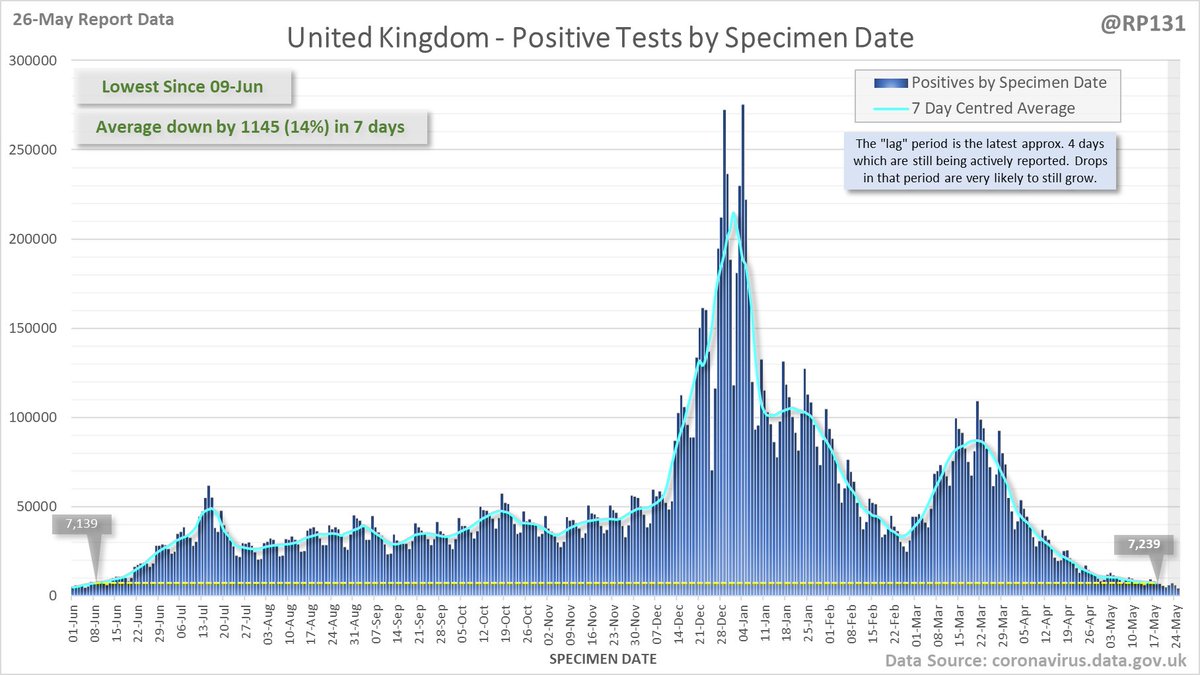
Longer term view. 8,369 new #covid19uk positive tests reported today (26-May). This brings the rolling average by specimen date (allowing 4 days for lag) to 7,239, equivalent to around 09-Jun (i.e. 344 days ago), a reduction of 1145 (14%) in the last week.