#covid19uk - Detailed positive tests thread. The majority of this thread is a set of views of rolling 7 day average positives per 100K by specimen date. Starting with England regions:
Some of the more detailed content from this thread has been moved to an external page to try and make the twitter updates a bit more manageable. You can still see the full version here: …ddatashare.s3-eu-west-1.amazonaws.com/Detail/Detail_…
UK nations:
Top 15 of just Upper Tier Local Authorities in England:
Regional / age distribution of today's newly announced positives for England.
Plus to see how it's shifting, here's the same values but with the same day last week for comparison:
England rolling average positives (per 100K population) by age range:
England regional rolling average positives (per 100K population) in the 60+ age range:
Age breakdown chart for Kettering (current top LA). Rolling average of positive tests by specimen date per 100K population of each age range.
Also age breakdown charts for rest of top 5: Rugby, Stafford, Allerdale and Corby.
Rolling weekly comparison of totals up to 3 days ago. This chart is useful to see the relative movements of the local authorities towards the top of the list.
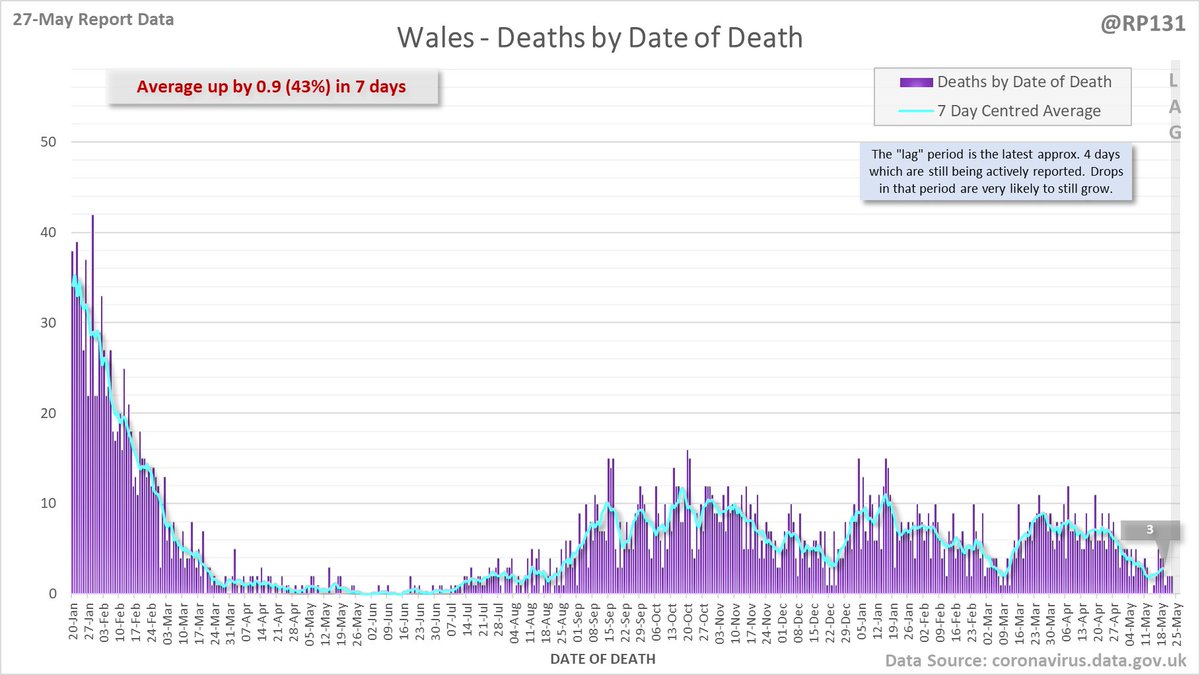
61 new #covid19uk deaths reported today (27-May). This brings the rolling average by date of death (allowing 4 days for lag) to 70, equivalent to around 21-Jul (i.e. 303 days ago), a reduction of 34 (33%) in the last week.
Closer look at the latest 45 days, with today's added numbers highlighted in orange. Individual nations and animated England charts further down the thread.
Longer term charts for England, Scotland, Wales and Northern Ireland.
4,661 new #covid19uk positive tests reported today (27-May).
Overall England is DOWN 22% on previous Friday and day-1 lateral flow positives are also down by 19%.
England's rolling average by specimen date has now been dropping since the 21st of March (67 days ago).
Chart to show England positive tests (as of 27-May) by breakdown of first infection events and possible reinfection events.
Possible reinfections were added to the data from 31-Jan and the rolling average vs. total tests is currently about 17%.
Longer term view. 4,661 new #covid19uk positive tests reported today (27-May). This brings the rolling average by specimen date (allowing 4 days for lag) to 6,958, equivalent to around 08-Jun (i.e. 346 days ago), a reduction of 1268 (15%) in the last week.
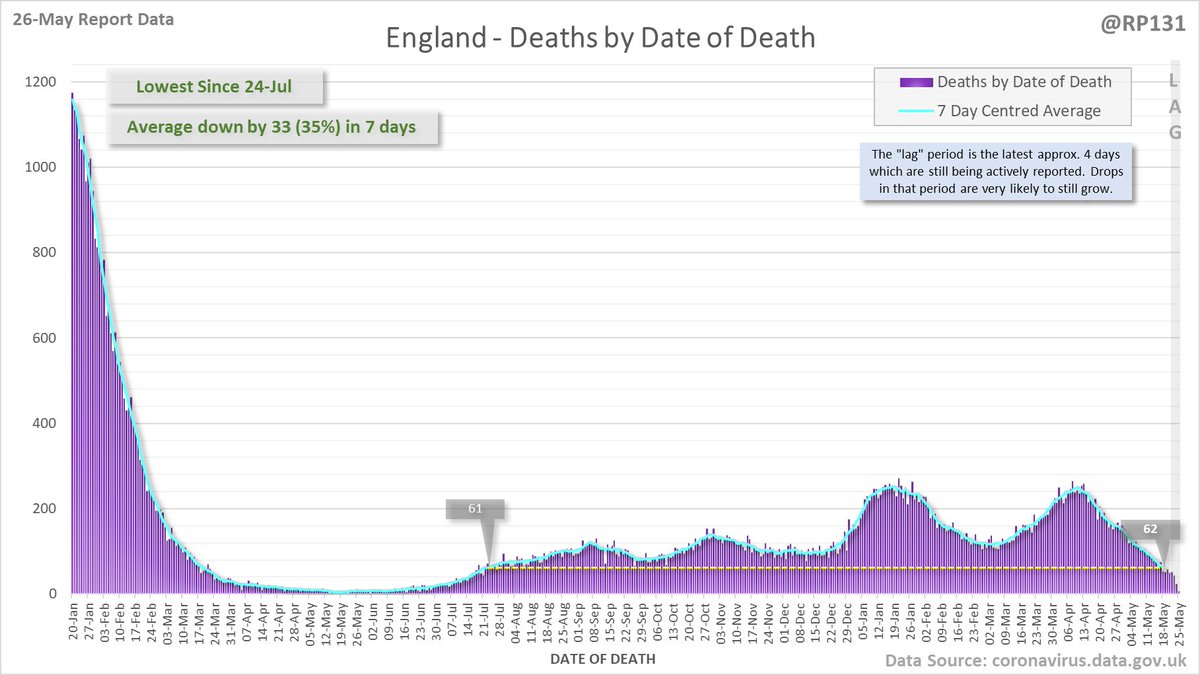
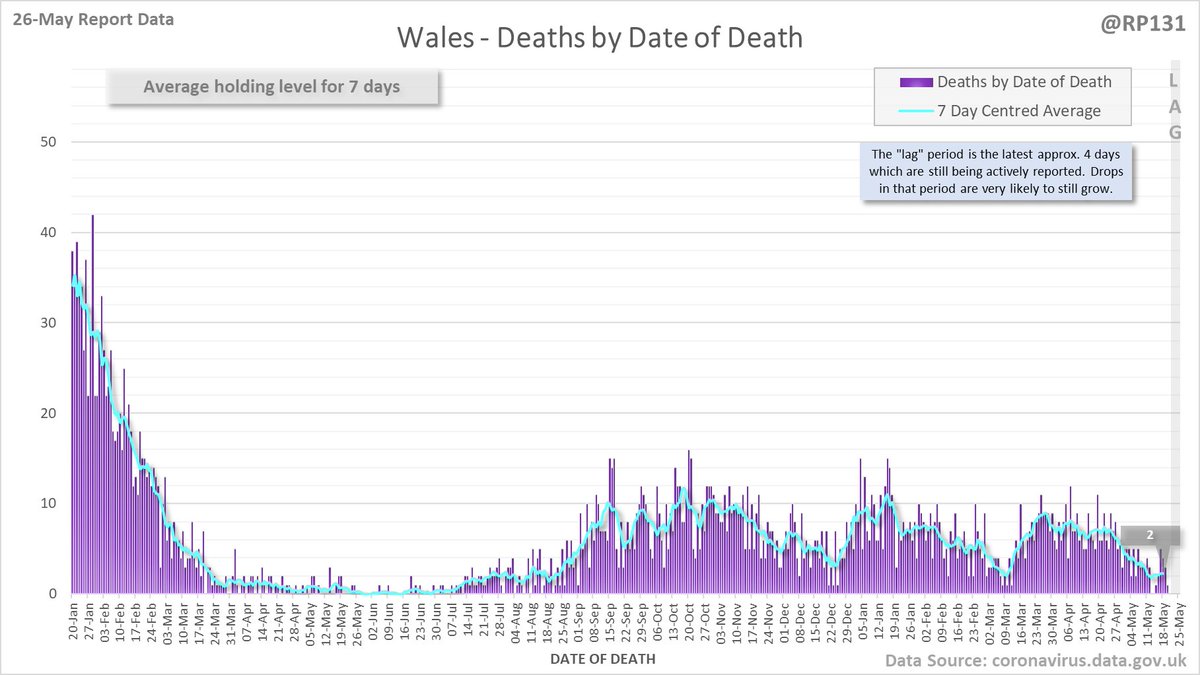
91 new #covid19uk deaths reported today (26-May). This brings the rolling average by date of death (allowing 4 days for lag) to 71, equivalent to around 24-Jul (i.e. 299 days ago), a reduction of 35 (33%) in the last week.
Closer look at the latest 45 days, with today's added numbers highlighted in orange. Individual nations and animated England charts further down the thread.
Longer term charts for England, Scotland, Wales and Northern Ireland.
8,369 new #covid19uk positive tests reported today (26-May).
Overall England is DOWN 21% on previous Thursday and day-1 lateral flow positives are also down by 16%.
England's rolling average by specimen date has now been dropping since the 21st of March (66 days ago).
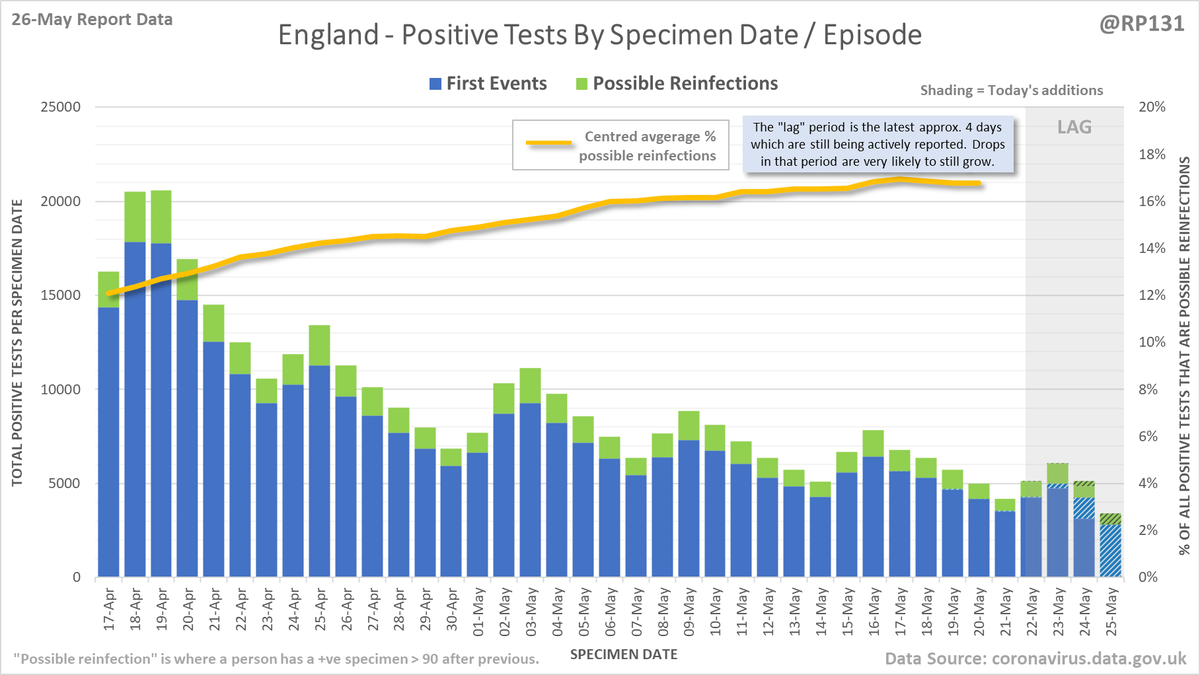
Chart to show England positive tests (as of 26-May) by breakdown of first infection events and possible reinfection events.
Possible reinfections were added to the data from 31-Jan and the rolling average vs. total tests is currently about 17%.
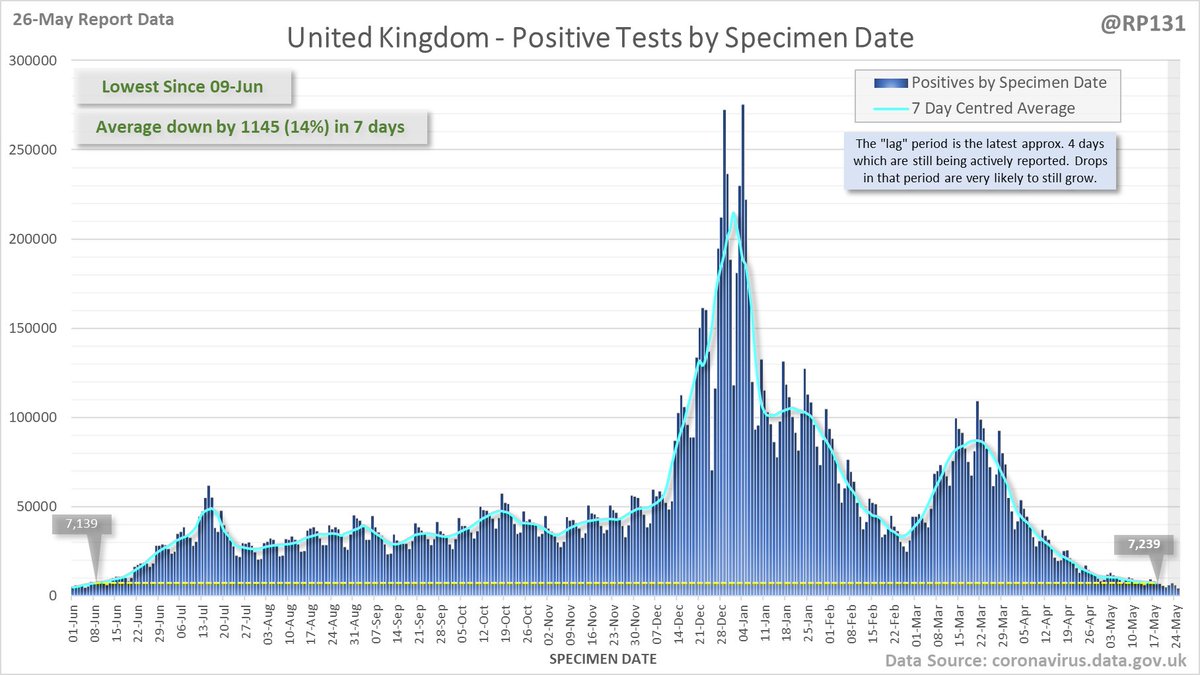
Longer term view. 8,369 new #covid19uk positive tests reported today (26-May). This brings the rolling average by specimen date (allowing 4 days for lag) to 7,239, equivalent to around 09-Jun (i.e. 344 days ago), a reduction of 1145 (14%) in the last week.