
Alright, how wants some fun analysis on Santander bikes? 

@TfL has a great API and I have been polling it for almost two weeks now to get the detailed status.
Firstly, there are almost 21,000 docks but only 8,000 bikes, so max dock occupation is 38%
Firstly, there are almost 21,000 docks but only 8,000 bikes, so max dock occupation is 38%

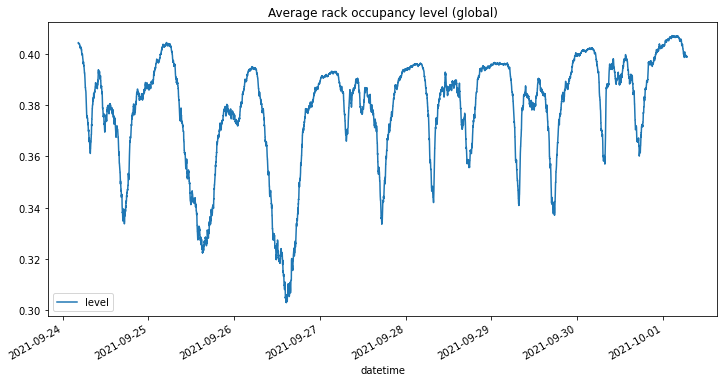
What surprised me that peak usage of the bikes is actually not that massive. Even at the lowest level of availability there were only 2,000 of the 8,000 bikes in use

usage patterns on the other hand are not surprising: big and sharp peak in the morning and in the evening, and constant drawdown during the day with a slight peak during lunch

one thing that was slightly bizarre was that for 4 days last weak the night peak was about 200 bikes short (10% of peak utilisation). Who was hogging the bikes at night?!?

Any. So whilst the over volatility in occupancy is not that much, on any individual station it is usually massive. Here Gloucester Road for example

So how often is a station "impaired", ie empty or full? Full, not that often. 200 stations never get full, and even the worst ones are full only 40% of the time

Who are those stations I here you asking? here we go -- all stations that are full more than 20% of the time

Empty is a different story -- less than 100 stations are never empty, and whilst the peak is also about 40-50% a lot more stations are in this area
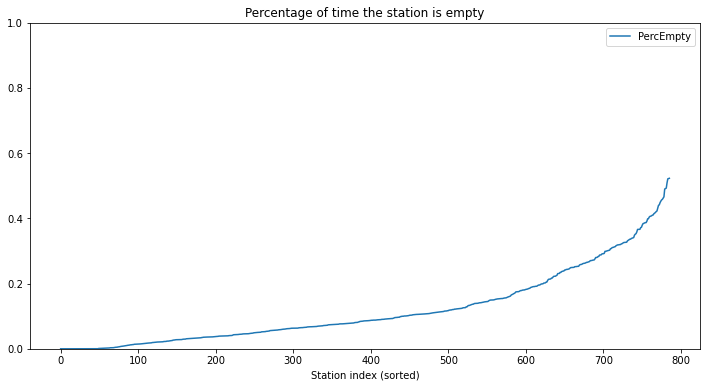
those are the stations -- Kensington, City, tourist areas

Here the geo plot of this data -- the darker the more often the stations are empty

The same for full stations -- it evened a bit out over the last week, but in the first few days there was a massive rim at the south boundary

(I started collecting data at a weekend, so my guess is that people use the bikes to drive home as far as they get and walk the rest)
Here for example the chart for Sunday the 19 September, at 4:32 BST (3:32 UTC in case you are wondering)

one important context though: if a station is “only” empty 40pc of the time this typically means “there are bikes available at night”
for example my local station — the reason why I started all this — generally starts emptying at 730 and is empty by 830. by 930 some bikes are back.
TLDR: percentages do not tell the full story
TLDR: percentages do not tell the full story
rack occupancy at 17:34 vs occupancy now (23:17)


so essentially people moved out from the center to the periphery (and to the train stations)
plenty of bikes available...

despite the weather some people are out there...
but then we see that by and large Londoners don't like the rain -- a lot less cycling today...

they do however come out now, at least in the High Street Kensington area...

yesterday vs today, both 12:25 BST; clearly a lot more going on in the centre when the weather is nice...


however, last night vs today shows that there still was some movement into central London


• • •
Missing some Tweet in this thread? You can try to
force a refresh


