How To Find Market Leaders During Corrections (Thread)
Market pullbacks and corrections are a natural process that may feel painful at first, but they set the stage for new true market leaders to emerge.
During a pullback the first thing you want to do is protect your capital and manage risk. You should rank your holdings and cut the lowest quality first.
How to grade your holdings with @mwebster1971
How to grade your holdings with @mwebster1971
Protecting your capital and naturally transitioning to higher cash levels keeps you focused and objective, allowing you to begin the fun part, the treasure hunt for the next uptrend’s golden opportunities.
During a correction, institutions take the market weakness as an opportunity to add to their highest conviction holdings. This support will show up in the price charts as stocks with promise buck the overall market downtrend.
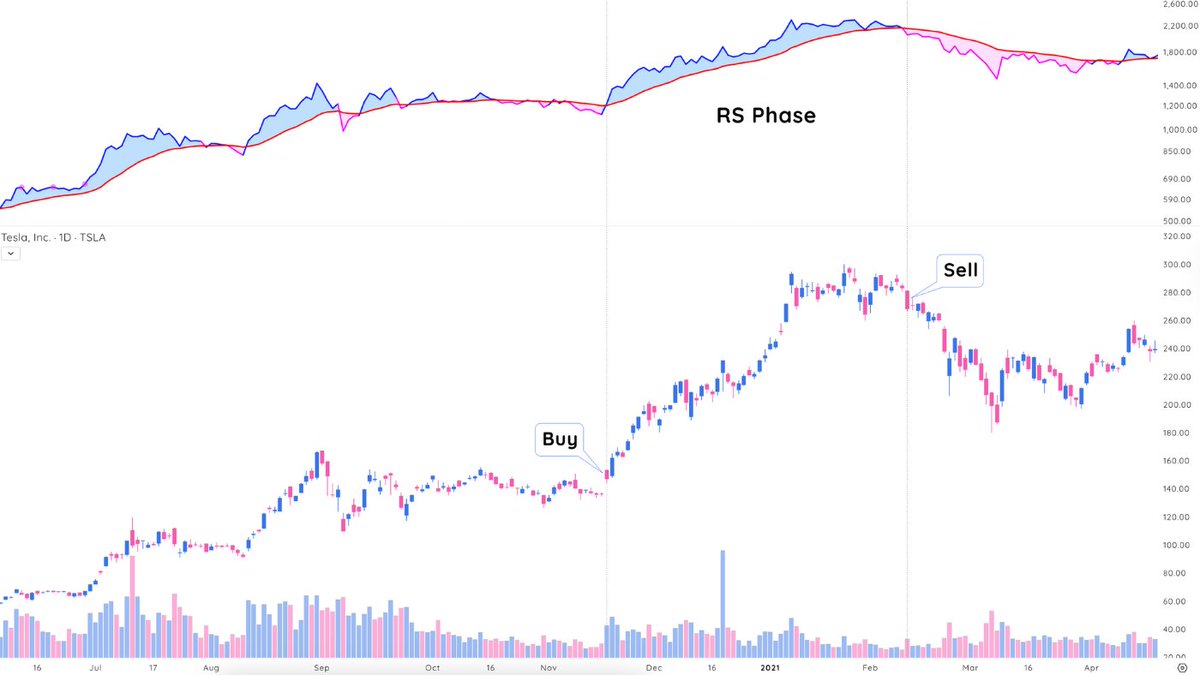
A quick and easy way to identify these stocks is to watch the relative strength line. If the RS line is increasing when the market is declining and pulling back, the stock is showing clear relative strength.
Nicolas Darvas said “I tried to detect those stocks that resisted the decline. I reasoned that if they could swim against the stream, they were the ones that would advance most rapidly when the current changed.”
This is as true today as it was when Darvas was trading.
This is as true today as it was when Darvas was trading.

Leaders under accumulation will hold short term moving averages and other key levels even as the market is making new lows.
Last week we saw heavy distribution on the indexes with the Nasdaq undercutting the prior week’s lows.
Last week we saw heavy distribution on the indexes with the Nasdaq undercutting the prior week’s lows.
Stocks that held an inside week and had strong weekly closing ranges are a good start for a relative strength list.
This RS list should be your go to when the market confirms a new uptrend. Each day you should update this list as new information comes to light.
This RS list should be your go to when the market confirms a new uptrend. Each day you should update this list as new information comes to light.
Pay special attention to stocks which appear on this list over and over. $DOCU is a good example of a stock that showed incredible strength during a correction before doubling in just a matter of weeks.

These Relative Strength lists also point you to overall groups that are holding up well.
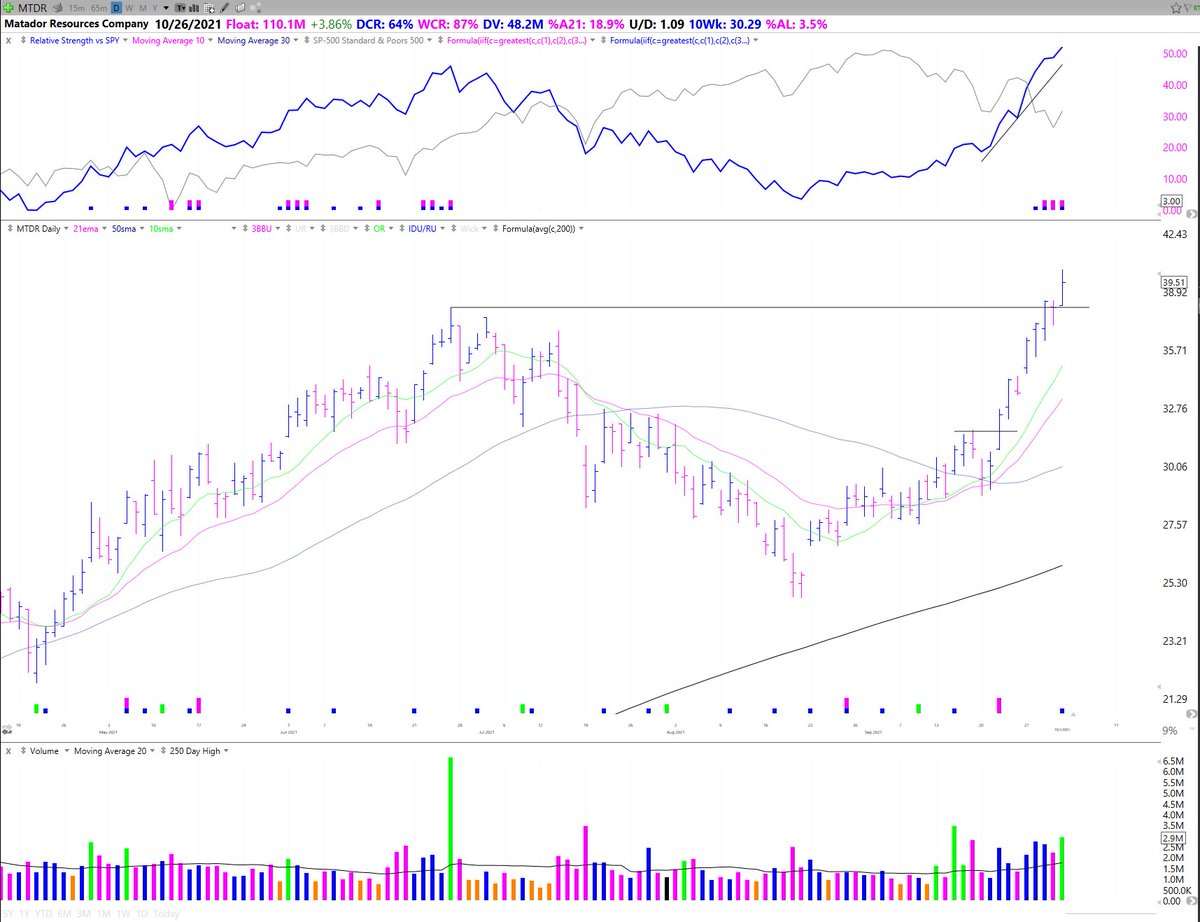
Currently Oil and Gas is outperforming with many stocks breaking out of bases into new ATHs.
Currently Oil and Gas is outperforming with many stocks breaking out of bases into new ATHs.

Recently, this group has not produced many of the biggest winners, so depending on your style you may prefer to sit in cash.
However, if you are an active trader, identifying this rotation early can lead to some excellent trades such as $MTDR through a consolidation pivot.
However, if you are an active trader, identifying this rotation early can lead to some excellent trades such as $MTDR through a consolidation pivot.
However, when the market starts pulling back, there is no way we can know how far. You have to treat pullbacks as corrections, and corrections as bear markets.
When the market is getting ready to resume its uptrend you will see decoupling from the growth stocks compared to the indexes.
For instance we may get a large gap down on the indexes but growth stock leaders will recover quickly and close the day strongly in the green. This is the first sign of a strong institutional bid.
This is where your Relative Strength lists come into play, the candidates which showed relative strength and supportive action over and over again and are moving out of constructive bases or off moving averages should be your initial buys in a new uptrend.
If these work then you can increase your position size or try new opportunities. However, you should always listen to the market for feedback, if you are quickly stopped out on these pilot buys, the market is telling you it’s not quite ready yet.
By following this process you will be a step ahead of others and be ready to position in high quality leaders with the potential to double and triple when the market comes off of lows.
The most important thing during a market pullback is to stay positive and focused on finding the next true market leaders. This homework will pay off but only if you have the discipline to stay in tune with the market and not check out.
Some current stocks that are holding up better than most are $AFRM $SKIN $AMBA $GLBE $LC $DDOG and $BILL
What are some other names that are holding up well and showing strong RS?
⬇️⬇️⬇️
What are some other names that are holding up well and showing strong RS?
⬇️⬇️⬇️
• • •
Missing some Tweet in this thread? You can try to
force a refresh