This is a thread about one of the market correlations that has been consistent over the past decade+, although I will be focusing on 2018-current. The SPX/VIX relationship everyone *knows* exists, but only assumes the correlation and its meaning. 1/13
$VIX is many things, but at its core it is a measure of implied volatility (IV) on $SPX. This represents the supply and demand in $SPX options. The demand comes from customers while the supply primarily comes from centralized market makers (MMs). 2/13
Because the MMs have more uniform goals (to isolate and collect premium on their options), the supply side is much easier to analyze. When you look at the SPX/VIX graph, you can’t help but notice how correlated it is. 3/13
Essentially, MMs have a liquidity comfort level on their offerings given a daily $SPX level. This would be the historically standard premium they are charging you for options on a daily basis. Considering what we know about delta hedging, there is a clear causation as well. 4/13
If $VIX goes up more than the change in $SPX would indicate, that is a sign that MMs are less willing to sell puts at these levels (VIX overstatement) and vice versa. This is usually in the case of an upcoming event. Once that event passes, IV invariably comes back down. 5/13
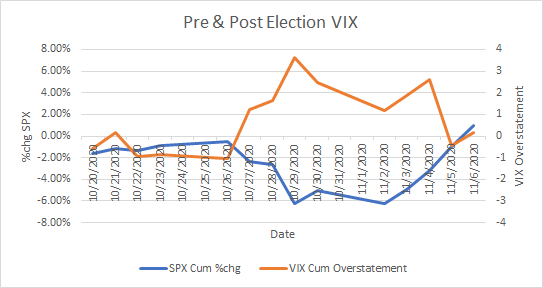
When IV declines, that unwinds hedges and we see massive rallies. Lets take the Biden/Trump election in Nov. 2020 as an example. Here is a chart where orange is the $VIX overstatement and blue is the $SPX return pre-election. 6/13
Demand was clearly rising for puts pre-election. A lot of that selling was due to MMs hedging those puts. If VIX overstates, market participants are hedging. If the market does not drop below the aggregate premiums on the option chain, be ready for mean reversion. 7/13
This is from charm and vanna: decay in IV that decreases the value of customer hedges and decreases the amount of hedging needed by MMs. When MMs decrease their hedges, they cover their shorts. What happened after the election didn’t result in the world exploding? 8/13
Not only did the VIX overstatement mean revert, but SPX did as well. The election wasn’t even settled until much later, and the market already made the decision that the world was not going to explode no matter who won.
Here's the cumulative chart during that time: 9/13
Do you need a quantitative measure of the deviation? On a daily basis, these are the returns of VIX overstatement when it is >-2.5 or <2.5.
Those two “outliers” that need to be taken seriously are 3/5/2020 and 3/13/2020. 10/13
There is a strong indication that when VIX overreacts (+ numbers) downside abates and a mean reversion will happen. The VIX underreactions tend to be soon after the overreactions. This is a a solid indicator but needs to be taken in context of the market at the time. 11/13
I don't have data to prove it yet, but this indicator scales. If you see a strong overreaction in a short amount of time, you are likely to see a small bounce. Cumulatively it works too, but I think it scales on a function of a log scale, so I have work to do on that front. 12/13
In the end, the action is to monitor the deviations VIX has from its SPX correlation. Develop a thesis around the situation it is tracking and act accordingly. It is very likely that we will see mean reversion in both VIX and SPX. 13/13
• • •
Missing some Tweet in this thread? You can try to
force a refresh
How important are option dealer hedging flows to market returns? How much impact does #0DTE have? How accurate is #Volland? To answer all of these questions, we wrote a white paper with Volland data. This paper is now available:
There is a lot of commentary about option dealer flows and their impact on the market. Volland is the most comprehensive public estimate of the dealer book expressed in notional greeks. We assess positioning at the trade level, store and aggregate every option trade, and show the greek imbalance on every option in ~225 equities.
First, on a swing basis, here is the total notional #delta change regressed against $SPX returns. This includes gamma hedging. It is interesting, but the R^2 is only at .35, and there seems to be quite a few stray data points.
Remarkably, #vega hedging is the strongest correlation from a greek perspective. With an R^2 of .49, and a similar slope to spot-vol correlation (inversed because of dealer hedging), this relationship is very tight.
Further, the stray points are clearly prejudiced to overvixing when markets drop hard and undervixing when markets rise fast. This is shocking because vega is a risk that dealers typically warehouse.
Since IV is a metric that is directly controlled by the trades and counterparties, dealers may be just adjusting IV in accordance to their vega position and underlying movement. This seems to be true if aggregate vega is always negative. So is it?
Good Morning! Today @myTradeHawk and I have a special Trader's Workshop show live at the Options Industry Conference. CBOE's Head of Product Intelligence Henry Schwartz will be on with us. Tune in at 9am EST, it is must watch. youtube.com/live/rQCmXI0In…
The @OptionsConf is a conference with companies that facilitate options trading. They include MMs, the OCC, exchanges, broker-dealers, clearing firms, etc. It is industry professionals only, so it is all about the plumbing of options from the plumbers themselves.
With so much high-level talent here, I want to know what their concerns are, and the future of options markets. There were a couple of trends in the discussion. One was about innovation. With daily expiries in $SPX and related products, was it handled well, and what's next?
Good Morning! Yesterday was a long-awaited post-opex downturn, but as I said numerous times, until markets cross $SPX 4K, this is a dip to eventually buy. That needs to be crossed within the next couple of weeks. Earnings will whip markets, but the key is tomorrow...
No, not GDP. Not PCE Thurs, not $META earnings, but the one macro event that could drive markets under $SPX 4K is the BoJ Interest Rate decision. After reading Ueda's statements over the past few weeks, I don't think anything will happen this month, but signaling is possible.
Ueda has spoken about price stability, and Core CPI remains elevated. He might signal a shift in policy that won't necessarily be hawkish, but he needs domestic investment so he may try to repatriate investment. Japan is the world's largest creditor, so this would send shockwaves
Good Morning! Another slow market day yesterday, but there should be some vol expansion over the next couple of days, as shown in the premarket. Several liquidity modelers showing we are overdue for a pullback, and any vol expansion will be bearish thanks to positive vanna.
Recently in my discord, I have been previewing earnings reports, both from #volland and @optionrats, and there is a loud, consistent theme... lower profit expectations, lower event vol. Across all sectors, all major companies particularly non-growth companies have lower earnings.
It isn't by a little bit either. $XOM, $BA, $MSFT, $CMG, $META... all of them are seeing reduces profits. Yet markets are floating up, increasing multiples to very high levels. Part of that is dealer hedging, but ultimately this will result in deflation.
Good Morning! Yesterday featured another meandering negative day until some dovish comments from a non-voting member of the FOMC accused of insider trading (Bostic) caused a rally, despite some hawkish comments from a voting member not accused of insider trading (Waller).
There was a lot of red in the days prior, so I imagine that this was just some pent-up bullishness looking for a reason to come out of the shadows. There is non-manufacturing PMI today and speeches by 4 non-JPow FOMC govs, one of them is Bostic again.
These events shouldn't move markets, but I wasn't expecting Bostic yesterday. It seems like Bostic, Bullard, and JPow move markets, and I don't understand why Bostic and Bullard do out of everyone. Maybe someone can clarify because they aren't the most influential.
Good Morning! A wild 0DTE day with swift and decisive activity yesterday, but again a modest loss. The past few weeks have been reminiscent of all of 2022. Rising rates taking down equities. Yesterday I meandered on Twitter a little more and noticed some prayers to vanna.
@jam_croissant popularized the "window of weakness", a period of 2 weeks after opex where vanna and charm have less of an effect. The subsequent weeks then have a bullish bias because of vanna and charm flows on option hedges for the month. Normally this is accurate, however...
The current environment is different. First, there is less hedging than there was even last month. Second, aggregate charm is currently positive. The 4000 strike was most popular for hedging in March and it is ITM, which makes its charm a bearish force unless we rally past it.