
On a zoom weminar hosted by @CalBike with renowned bike researchers John Pucher and @buehler_ralph on international international comparisons in biking!
🧵
🧵
Here is the share of trips made by bike across North America, Europe, and Japan. Huge variation across countries, with English speaking nations lagging behind. 

But these differences are not because those countries are more dense! In the US, our share of bikes used for even short trips are tiny!
Whereas in the Netherlands, nearly half of all 1-2.5 mile trips are on a bike.
Whereas in the Netherlands, nearly half of all 1-2.5 mile trips are on a bike.

But there have been massive changes in the last couple decades. Despite having low rates today, some US cities have seen a large percentage increase.
But look at Bogota, Sevilla, and Frankfurt! They have gone from low rates to relatively high rate very fast!
But look at Bogota, Sevilla, and Frankfurt! They have gone from low rates to relatively high rate very fast!

Focusing on Latin America, there are huge differences across the continent. And some very notable change in recent decades.

Now a piece of bad news. Biking across China has decreased, substantially.
This is due to increasing wealth (more cars), leading to large investments in car infrastructure.
Also worth noting is the massive rollout of transit across the country.
This is due to increasing wealth (more cars), leading to large investments in car infrastructure.
Also worth noting is the massive rollout of transit across the country.

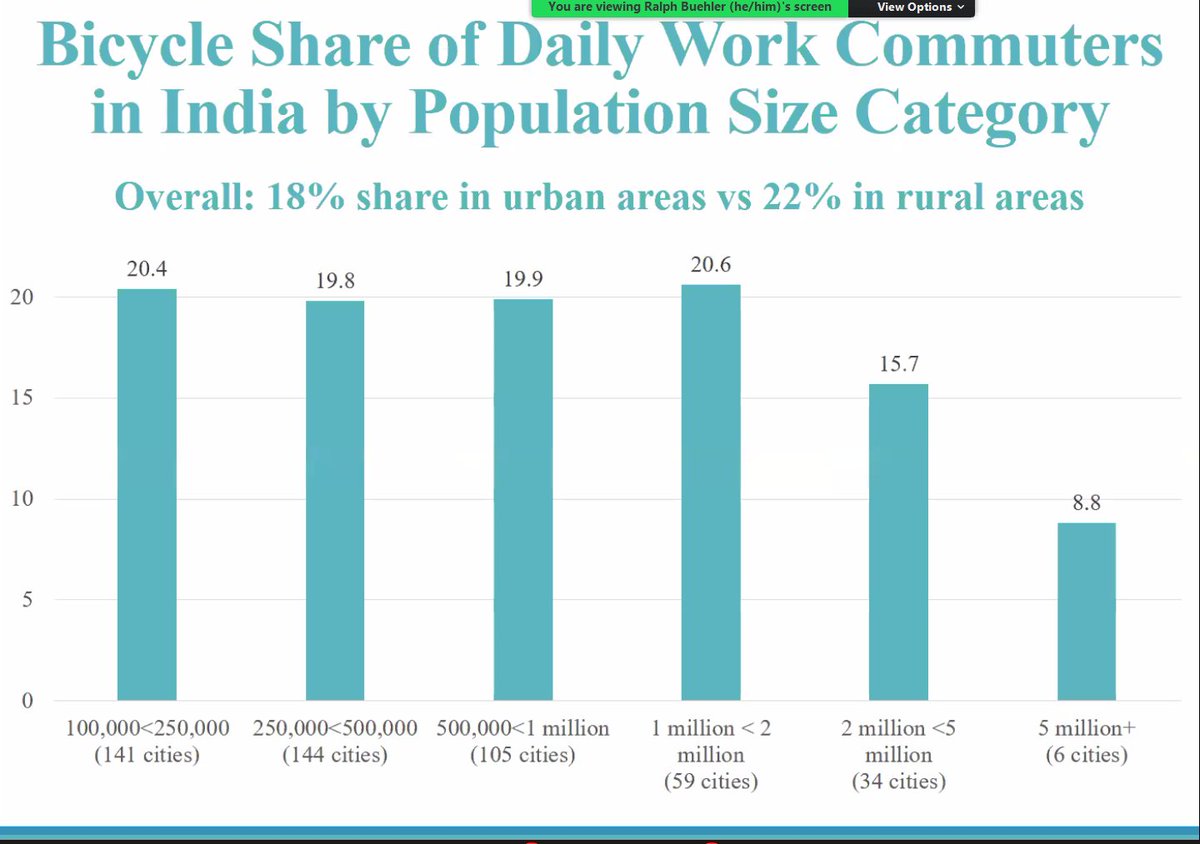
Perhaps surprisingly high rates of cycling in India, with higher rates in rural areas than in urban areas.
India also has a very high disparity in gender, with far more men riding than women.
India also has a very high disparity in gender, with far more men riding than women.
Speaking about gender and cycling, there are massive differences in the share of cycling done by women.
In English-speaking countries, less than a third of riders are women, where in Japan, Denmark, and the Netherlands, women make up a majority.
In English-speaking countries, less than a third of riders are women, where in Japan, Denmark, and the Netherlands, women make up a majority.

Fascinating figure on age and cycling.
In all countries, the highest share of riders are those who can't drive. But then things vary subtantially.
Japan and Germany have no age disparity in riding. In the Netherlands, older adults actually ride at the higher adult rate.
In all countries, the highest share of riders are those who can't drive. But then things vary subtantially.
Japan and Germany have no age disparity in riding. In the Netherlands, older adults actually ride at the higher adult rate.

E-bike sales have been exploding across the world, especially in Germany, where nearly a million were sold in 2018 (in a country of 83 million)

Safety and cycling rate are highly correlated in both directions.
When more people bike, more people build political power to make biking safer.
But when biking feels dangerous, most risk-averse people avoid it unless they have no other choice.
When more people bike, more people build political power to make biking safer.
But when biking feels dangerous, most risk-averse people avoid it unless they have no other choice.

And while bicycle safety has been improving in the UK, Germany, Denmark, and the Netherlands, it's been getting *worse* in the US since 2008-2010.
What are we doing here? Rising drunk driving, more speeding, larger cars, all trends going in the wrong direction in the US.
What are we doing here? Rising drunk driving, more speeding, larger cars, all trends going in the wrong direction in the US.

Zooming in on three world cities, we see cycling increasing in NYC, London, and Paris, with the latter really taking the lead.

By building *protected* infrastructure, each city has seen substantial improvements in cycling safety.


Let us remember that our cities *can* change. Every street configuration is a political choice.
See how other countries have chosen to undo the mistakes of the past.
See how other countries have chosen to undo the mistakes of the past.


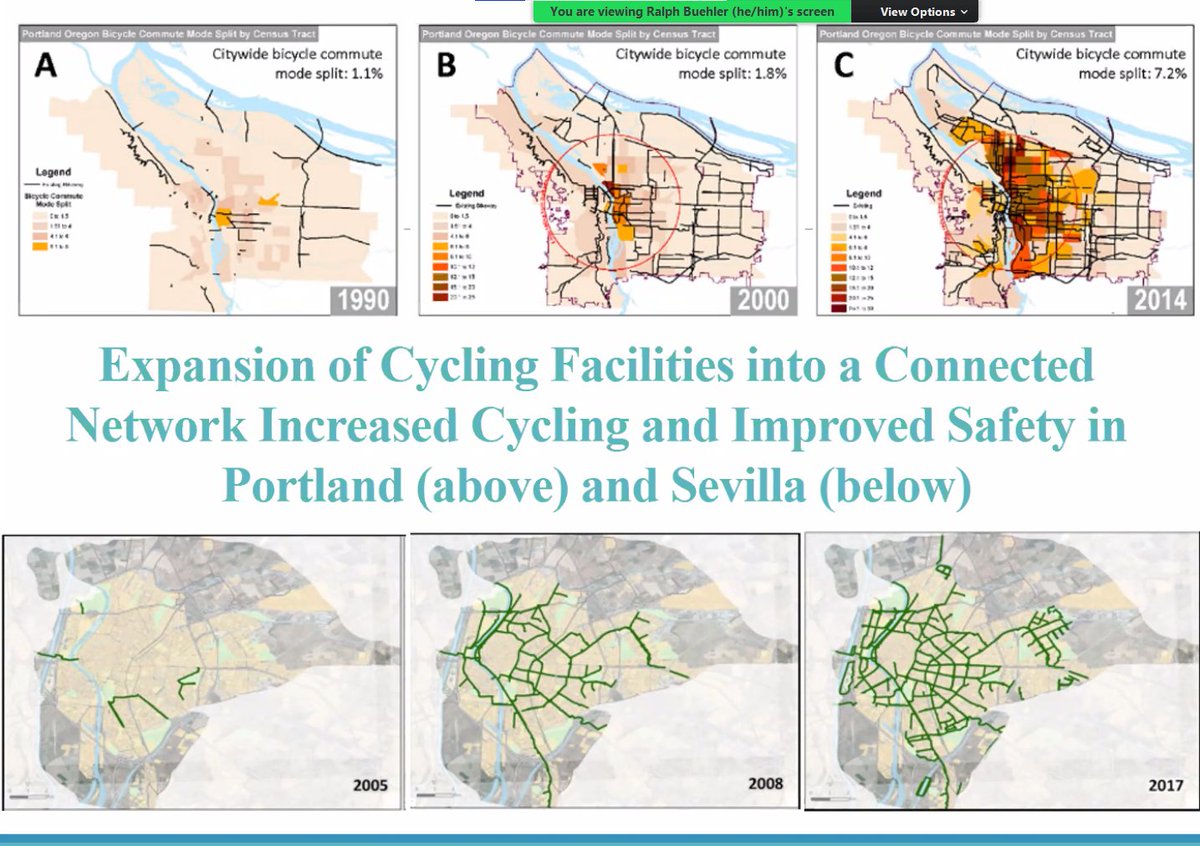
And those changes *do* work. When both Portland and Sevilla began building out their bike networks, more and more people started riding bikes.
The most important thing we can do to make our streets safer is reduce speeds. Crashes will happen, but when they happen at low speeds, no one dies.
The key inflection point is 30 kph (18.5 mph). Our neighborhood streets must be kept at that speed or below.
The key inflection point is 30 kph (18.5 mph). Our neighborhood streets must be kept at that speed or below.

This can be done by creating slow streets and narrowing roads making bike infrastructure as we usually think of it actually unnecessary.
Fire departments fight tooth and nail here in the US on this front. Interestingly, we don't see Dutch cities engulfed in flames.
Fire departments fight tooth and nail here in the US on this front. Interestingly, we don't see Dutch cities engulfed in flames.


Here are the strategies for implementation.
We need advocacy, integrated policy across all levels of government, and political appetite for *disincentivizing driving*
The carrot for biking does not work unless you have a stick making driving less convenient for all trips.
We need advocacy, integrated policy across all levels of government, and political appetite for *disincentivizing driving*
The carrot for biking does not work unless you have a stick making driving less convenient for all trips.

In summary, we need to reform land use, parking, and integration with transit.
We need to push people away from driving and pull them toward biking.
Crucially, this work need to be paired with social/racial equity consideration to prioritize vulnerable and disadvantaged groups
We need to push people away from driving and pull them toward biking.
Crucially, this work need to be paired with social/racial equity consideration to prioritize vulnerable and disadvantaged groups

• • •
Missing some Tweet in this thread? You can try to
force a refresh


