So friends here is the thread on the recommended pathway for new entrants in the stock market.
Here I will share what I believe are essentials for anybody who is interested in stock markets and the resources to learn them, its from my experience and by no means exhaustive..
Here I will share what I believe are essentials for anybody who is interested in stock markets and the resources to learn them, its from my experience and by no means exhaustive..
First the very basic : The Dow theory, Everybody must have basic understanding of it and must learn to observe High Highs, Higher Lows, Lower Highs and Lowers lows on charts and their implications.
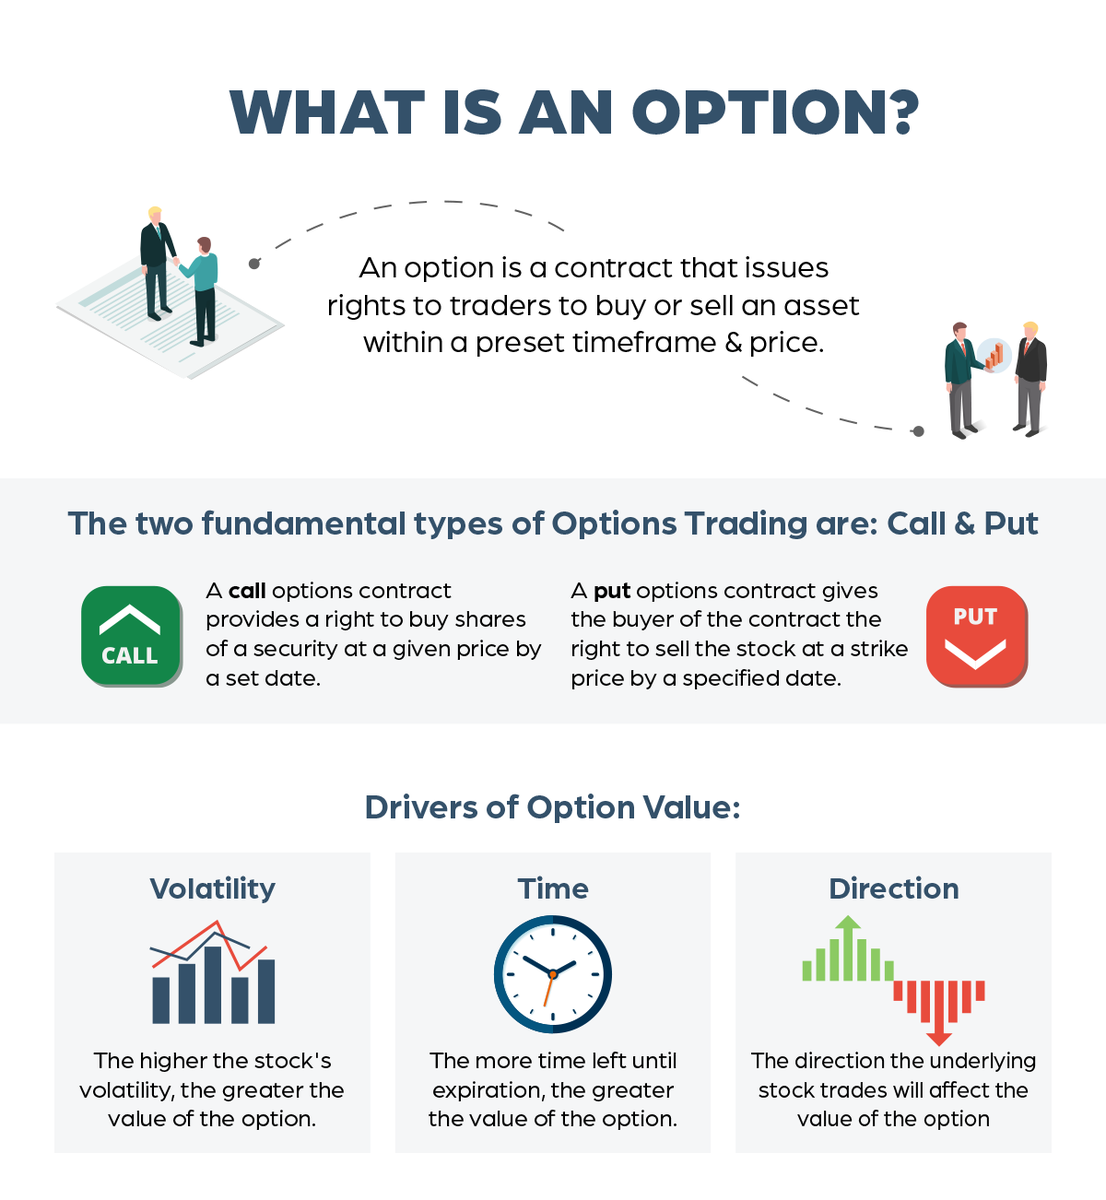
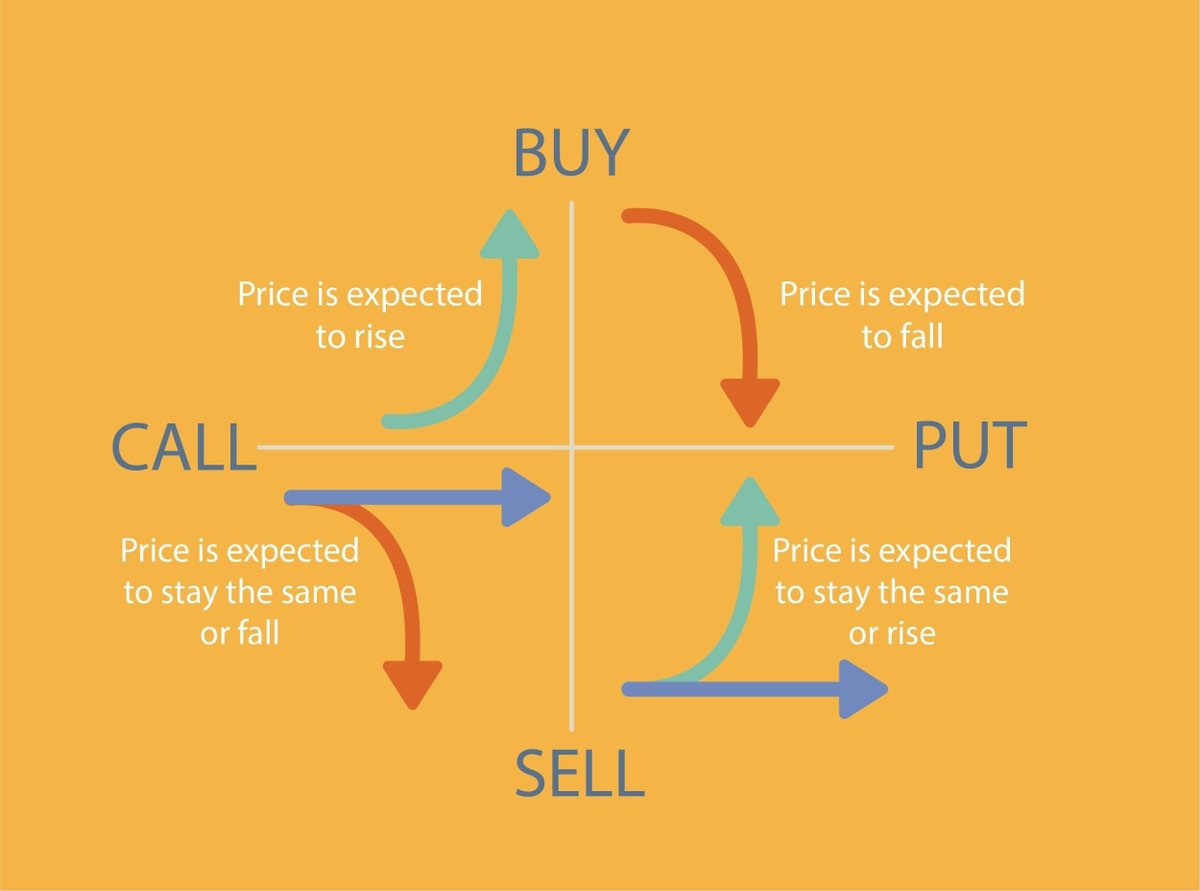
flowbank.com/en/research/wh…
flowbank.com/en/research/wh…
Even those who are more inclined towards fundamental side can also benefit from Dow theory, as it can hint start & end of Bull/Bear runs thereby indication entry and exits. 

Next basic is Wyckoff's Theory. It tells how accumulation and distribution happens with regularity and how the market actually moves.
tradingcoach.co.in/richard-wyckof…
tradingcoach.co.in/richard-wyckof…
With the basics, out of the way we'll now see some basics of Technical Analysis.
First concepts to be learned are finding support and resistance on charts or price levels.
tradeciety.com/5-ways-to-find…
First concepts to be learned are finding support and resistance on charts or price levels.
tradeciety.com/5-ways-to-find…
The support and resistance (S&R) are specific price points on a chart expected to attract the maximum amount of either buying or selling, hence they are very important levels on chart.
For breakouts, they are very very important !
zerodha.com/varsity/chapte…
For breakouts, they are very very important !
zerodha.com/varsity/chapte…
Time for a video on basics of Technical Analysis. If you need only one, this is it.
Trendlines are also important. Just one important point, horizontal trend lines are more effective than sloping trendlines, because a breakout from horizonal levels is high probability breakout as compared to a breakout from sloping trendline.
dailypriceaction.com/forex-beginner…
dailypriceaction.com/forex-beginner…
When we know how to draw trendlines and Support & Resitance (They are also trendlines only) we can move to Chart patterns that are formed by combining trendlines and few more inputs.
Here are most important ones.
optionalpha.com/blog/13-stock-…
Here are most important ones.
optionalpha.com/blog/13-stock-…
I would complete the Technical Analysis part with this gift from @nooreshtech Sir who is an accomplished Technical Analyst.
This is his workbook on Technical Analysis nooreshtech.co.in/wp-content/upl…
No need to buy expensive books on Technical Analysis.
This is his workbook on Technical Analysis nooreshtech.co.in/wp-content/upl…
No need to buy expensive books on Technical Analysis.
Now we'll see indicators, they are of 4 types:
Trend indicators : For direction and strength
Momentum indicators : For the speed of price movement
Volatility Indicators : For measuring fluctuations
Volume Indicators : For measuring strength of trend based on volume traded
Trend indicators : For direction and strength
Momentum indicators : For the speed of price movement
Volatility Indicators : For measuring fluctuations
Volume Indicators : For measuring strength of trend based on volume traded
Indicators introduction : A picture is worth thousand words

A very important tool is Bollinger Band. This incorporates moving average and statistics and can produce wonderful results in the hands of a deft person.
Thanks @bbands for this excellent tool.
bollingerbands.com/bollinger-band…
Thanks @bbands for this excellent tool.
bollingerbands.com/bollinger-band…
Often there is a tendency of overloading the chart with too many indicators ! Keep them to bare minimum. Remove one by one till you can’t remove any further.

Another important point worth highlighting is combination of wrong indicators. If somebody uses RSI, MACD and Stochastic then what he/she will see is same view across all the indicators giving a false sense of confirmation by all 3 indicators. They belong to the same category.
So combine a trend indicator with momentum indicator and you are all set. Find your own combination.
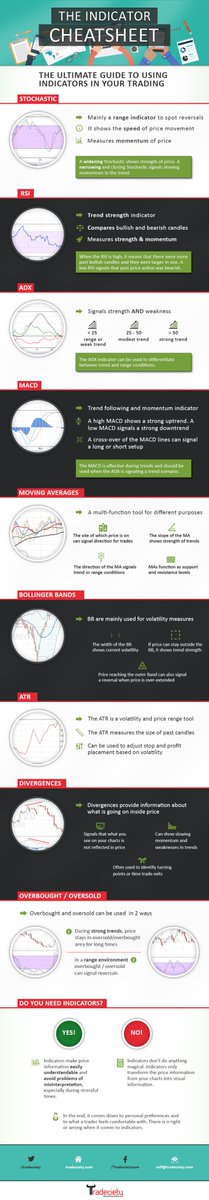
An indicator cheat sheet is here
An indicator cheat sheet is here
After having fun with all the girlfriends/boyfriends there comes a time when everybody has to settle. Similarly after experimenting with all the indicators there comes a time when the trader decides that Price Action is best and instead of all these indicators i must focus on PA
All the indicators/oscillators are based on either price or volume or a combination of both.
So once a person sees this light, he shifts to another gear increasingly trades on price Action, only occasionally taking support of indicators.
priceaction.com/price-action-u…
So once a person sees this light, he shifts to another gear increasingly trades on price Action, only occasionally taking support of indicators.
priceaction.com/price-action-u…
Those who want to do a deep dive in price Action, may read these books.
Caution : These are only for advance readers.
Caution : These are only for advance readers.


Now coming to my Bread & Butter : Breakout Trading.
Accumulation, Distribution and Breakouts are regular feature in markets. One or the other is always happening in some stocks.
In Roaring Bull markets, Breakouts increase as now a days we are seeing daily.
Accumulation, Distribution and Breakouts are regular feature in markets. One or the other is always happening in some stocks.
In Roaring Bull markets, Breakouts increase as now a days we are seeing daily.
Breakouts often happen after long consolidations. Longer the consolidation, stronger the breakout.
And the breakout may be in upside or downside both. If it happens after accumulation, it will be a bullish breakout and after distribution, it'll be bearish breakout.
And the breakout may be in upside or downside both. If it happens after accumulation, it will be a bullish breakout and after distribution, it'll be bearish breakout.
And Breakouts are not only for trading, they make solid base for investing. If a fundamental investor enters a stock on breakout than it may give many successive breakouts and can reach stratospheric levels.
I simple love breakouts.
dotnettutorials.net/lesson/breakou…
I simple love breakouts.
dotnettutorials.net/lesson/breakou…
Legends on Breakouts
Opening range Breakout is a very popular strategy and it can be used in Stocks as well as Indices.
Wait for first 45 minutes, let the market settle and an opening range get formed. Now if any candle opens above or below this range, take trade in the direction of breakout.
Wait for first 45 minutes, let the market settle and an opening range get formed. Now if any candle opens above or below this range, take trade in the direction of breakout.
ORB has high success rate, but it should be avoided if the first 45 minute candle is too large as compared to previous average min candles on the chart.
dotnettutorials.net/lesson/opening…
dotnettutorials.net/lesson/opening…
here are some breakout scanners. You may checkout and found if any of the suits you, else you may make your own, we have to look for long compression.
chartink.com/screener/daily…
chartink.com/screener/posit…
chartink.com/screener/long-…
chartink.com/screener/scs-s…
chartink.com/screener/long-…
chartink.com/screener/daily…
chartink.com/screener/posit…
chartink.com/screener/long-…
chartink.com/screener/scs-s…
chartink.com/screener/long-…
Another good site full of readymade free scanners is
topstockresearch.com
May look at this specific scanner for finding potential breakout candidates:
topstockresearch.com/rtScreener/Nar…
topstockresearch.com
May look at this specific scanner for finding potential breakout candidates:
topstockresearch.com/rtScreener/Nar…
Once you get a list of potential breakout candidates, please check:
Their support and resistance on daily/weekly & monthly charts
Their previous swing highs and any runaway gaps.
Then see if there are any breakout patterns forming
pro.benzinga.com/blog/5-common-…
Their support and resistance on daily/weekly & monthly charts
Their previous swing highs and any runaway gaps.
Then see if there are any breakout patterns forming
pro.benzinga.com/blog/5-common-…
One of the most crucial things in trading and also in investing is how to trail profits. Most of the times we either exit early or exit too late, in both the cases we regret.
Trailing is the solution, But its quite difficult thing to master. I'll try to simplify
Trailing is the solution, But its quite difficult thing to master. I'll try to simplify
Pivots & EMA crossover - For intraday use 5/15 Min chart and smaller EMAs and for long term investing use daily and weekly charts and biggers EMAs.
RSI and ADX alphaexcapital.com/rsi-adx-strate…
MFI & EMA crossover - therobusttrader.com/money-flow-ind…
RSI and ADX alphaexcapital.com/rsi-adx-strate…
MFI & EMA crossover - therobusttrader.com/money-flow-ind…
Positional or Swing Trading based on relative strength: we'll see.
Relative strength tells us how a stock is doing in comparison to he Index. If nifty is going up by X speed and one stock is going by X+10 and another by X-10 which one will we chose ?
monetta.com/2019/10/23/may…
Relative strength tells us how a stock is doing in comparison to he Index. If nifty is going up by X speed and one stock is going by X+10 and another by X-10 which one will we chose ?
monetta.com/2019/10/23/may…

Here is a Tradingview custom indicator that lets you easily find out relative strength of any stock with nifty.
in.tradingview.com/script/OhSlks3…
in.tradingview.com/script/OhSlks3…
• • •
Missing some Tweet in this thread? You can try to
force a refresh