MAPE is another metric used in performance evaluation in machine learning.
The formula looks a tad bit complex but it isn't.
Let's try to break it down. ↓
The formula looks a tad bit complex but it isn't.
Let's try to break it down. ↓

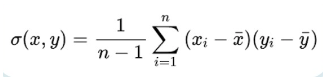
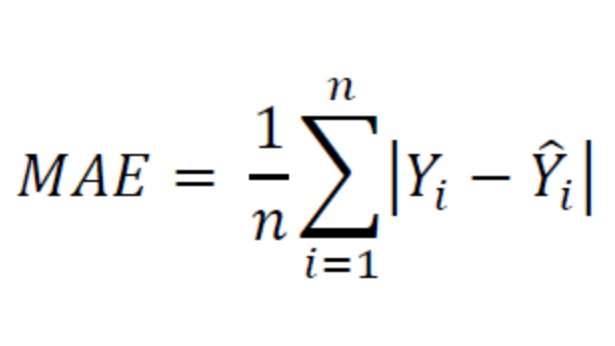
• To start with, Mean Absolute Error is a metric which shows how far a value is to the target value.
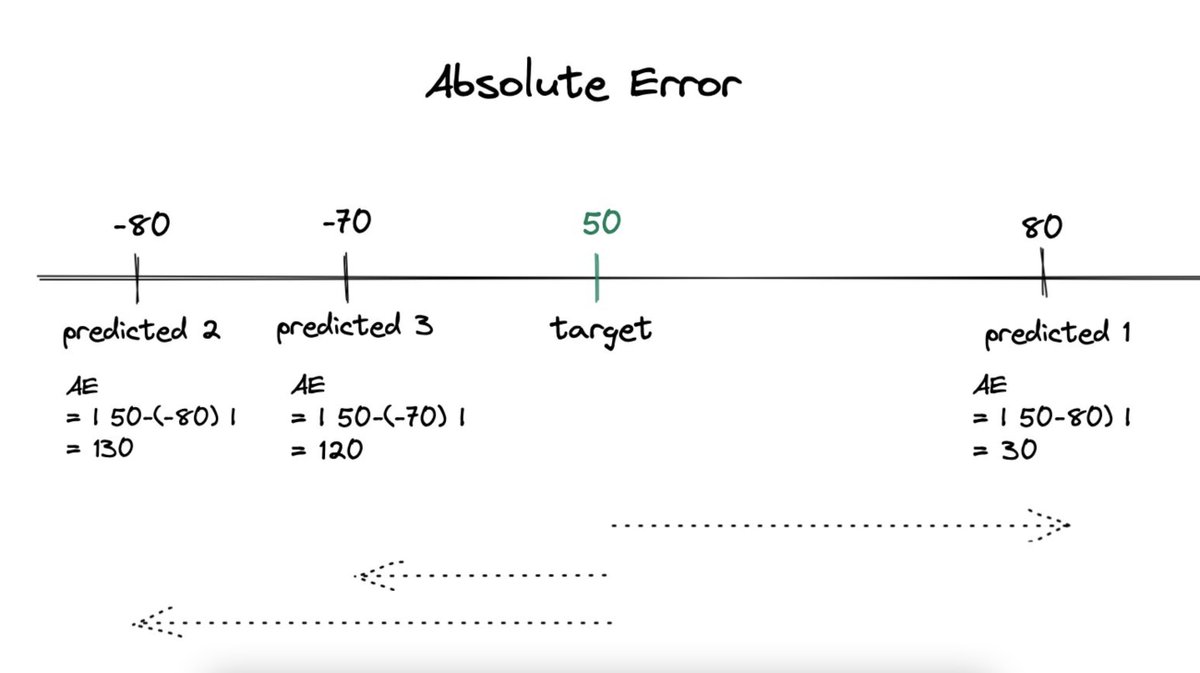
• To get the absolute error, we can just subtract the predicted value from the target value and remove the sign.
• We can sum the errors and divide by total to get the mean absolute error.
• We can sum the errors and divide by total to get the mean absolute error.
• This is useful, say we are predicting the prices of cars which are sedan.
• Mean Absolute Error would provide average error value on all the sedan cars.
• If MAE is 5k means that we are predicting off by $5k on average on sedan cars. This could be both 5k less or 5k more.
• Mean Absolute Error would provide average error value on all the sedan cars.
• If MAE is 5k means that we are predicting off by $5k on average on sedan cars. This could be both 5k less or 5k more.

• This gives us a good estimate in terms of price how wrong we are.
• But what if we our data also contains SUV cars?
• This would create problem as the price range of SUVs is generally higher so, the error range on SUVs could also be higher compared to sedan's 5k.
• But what if we our data also contains SUV cars?
• This would create problem as the price range of SUVs is generally higher so, the error range on SUVs could also be higher compared to sedan's 5k.

• Now we can't actually say that an error of somewhere around 8k on SUV is worse than 5k on Sedan.
• If the price of the SUV is 80000 and of sedan is 50000, both of the errors are same in terms of percentage (10%).
• If the price of the SUV is 80000 and of sedan is 50000, both of the errors are same in terms of percentage (10%).
• So we can see that in scenarios where the target ranges vary, calculating percentage error could be useful.
• As it gives us normalised and scale independent error values unlike absolute errors.
• As it gives us normalised and scale independent error values unlike absolute errors.
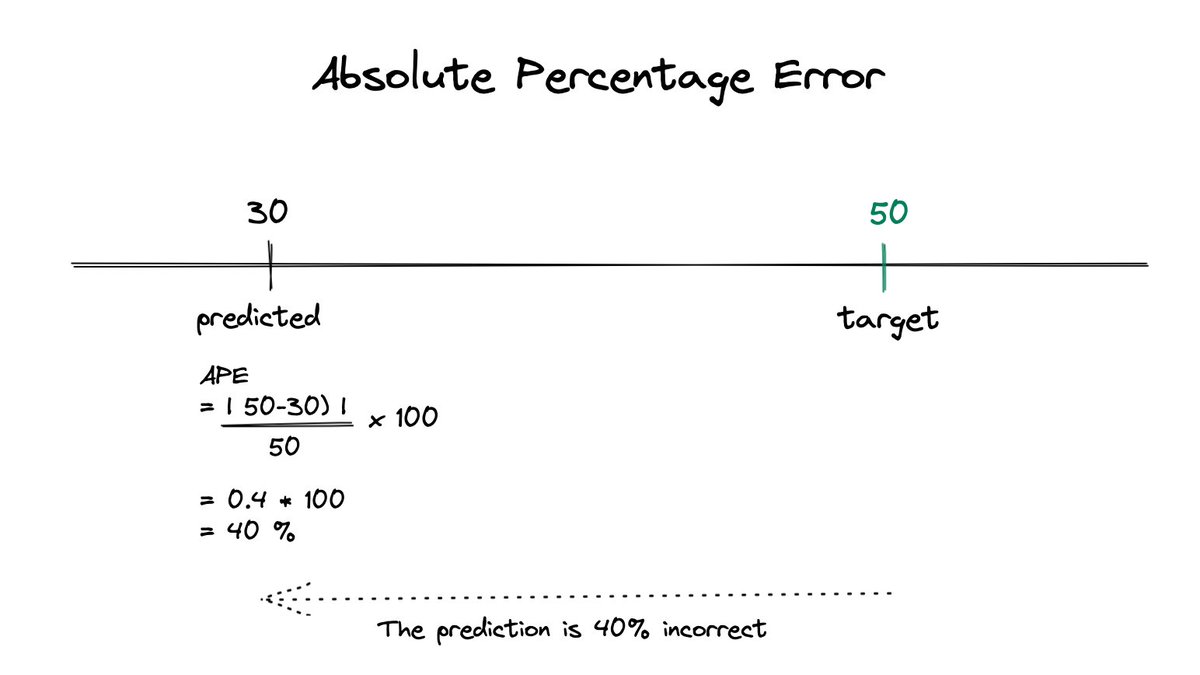
• To convert absolute errors to absolute percentage errors, we need to divide the absolute error terms with the target values.
• Sum those percentage errors.
• Then multiply by 100% and divide by the number of observations to calculate the mean.
• Sum those percentage errors.
• Then multiply by 100% and divide by the number of observations to calculate the mean.
• This gives us our Mean Absolute Percentage Error and a fair scale of comparison for the errors.
• MAPE is widely used in Time-Series Forecasting.
• But MAPE also has its downsides:
• MAPE is widely used in Time-Series Forecasting.
• But MAPE also has its downsides:
1. One of the limitation is using MAPE when the target or the actual values are on lower scale.
If the values lie on lower range like (0, 2, 10, 5) the percentage errors can be quite large, even greater than 100% error.
If the values lie on lower range like (0, 2, 10, 5) the percentage errors can be quite large, even greater than 100% error.

2. MAPE is asymmetric and penalises more when the predictions are higher than the target values.
For predictions lower than target, the upper limit is 100%, while for over predictions there is no limit, it could be 200% , 400%, 800% and so on...
For predictions lower than target, the upper limit is 100%, while for over predictions there is no limit, it could be 200% , 400%, 800% and so on...
3. There is the problem of dividing by zero.
If the value of the prediction target is 0, the division by zero problem occurs making it unable to calculate MAPE for that observation.
If the value of the prediction target is 0, the division by zero problem occurs making it unable to calculate MAPE for that observation.
Here is a python function for the Mean Absolute Percentage Error.

Overall, MAPE is a very useful and widely used metric.
Make sure to use it in conjunction with other metrics to get unbiased and unmistaken conclusions.
Thanks for reading!
Make sure to use it in conjunction with other metrics to get unbiased and unmistaken conclusions.
Thanks for reading!
• • •
Missing some Tweet in this thread? You can try to
force a refresh