I’m a full time day/swing trader for a living.
I’ve learned a lot through my time trading.
Here’s a thread going over my exact trading strategy
As well as some helpful tips/tricks.
👇👇👇
I’ve learned a lot through my time trading.
Here’s a thread going over my exact trading strategy
As well as some helpful tips/tricks.
👇👇👇
My trading strategy revolves around three things:
1. Supply and Demand
2. Trend
3. Liquidity
All are important and essential for my trade setup.
1. Supply and Demand
2. Trend
3. Liquidity
All are important and essential for my trade setup.
Supply and Demand: What is it?
Supply and Demand zones are areas of price where institutional buying or selling is taking place. These zones are key because price is likely to reverse at these zones since institutions want to defend or add to their position.
Supply and Demand zones are areas of price where institutional buying or selling is taking place. These zones are key because price is likely to reverse at these zones since institutions want to defend or add to their position.
To find these zones, you want to look at the SPEED of price action. Supply/Demand zones are formed when price moves FAST from an area. Look for wicks or long body candles. 

How to draw zones?
To draw these zones, you take the top of the body or wick of the candle PREVIOUS to the explosive candle and draw it down to the bottom. Extend the zone and there it is. (Knowing whether to use the wick or top of the body will take experience)
To draw these zones, you take the top of the body or wick of the candle PREVIOUS to the explosive candle and draw it down to the bottom. Extend the zone and there it is. (Knowing whether to use the wick or top of the body will take experience)


Where to enter?
Entry should be at the top of the zone with a hard stop just underneath the bottom of the zone. Targets will be based off a multitude of things, some mentioned further. These zones work on all time frames and all stocks, futures, cryptos, etc.
Entry should be at the top of the zone with a hard stop just underneath the bottom of the zone. Targets will be based off a multitude of things, some mentioned further. These zones work on all time frames and all stocks, futures, cryptos, etc.
Fresh vs Tested Zones
I am only interested in taking entries at FRESH supply/demand zones. Fresh zones are ones where price hasn’t been tested yet. Look at pics below
I am only interested in taking entries at FRESH supply/demand zones. Fresh zones are ones where price hasn’t been tested yet. Look at pics below


Gaps
Large gaps in stocks also act as supply/demand zones. If you think about it, it’s essentially the fastest move a stock can have, making them one of the best trades. Here’s a gap fill demand trade I took last week on $WDAY
Large gaps in stocks also act as supply/demand zones. If you think about it, it’s essentially the fastest move a stock can have, making them one of the best trades. Here’s a gap fill demand trade I took last week on $WDAY

Let’s move onto trend.
Identifying trend is key to making sure you are on the right side of the move. Identifying trend is simple. Zoom out to the largest time frame and see if price is making higher highs (HH) and higher lows (HL) or Lower highs (LH) and Lower Lows (LL)
Identifying trend is key to making sure you are on the right side of the move. Identifying trend is simple. Zoom out to the largest time frame and see if price is making higher highs (HH) and higher lows (HL) or Lower highs (LH) and Lower Lows (LL)
As you can see, BA is clearly in an uptrend making HH and HL. I only want to be buying at demand zones during an uptrend and selling at supply zones during a down trend.

Strong/Weak Lows and Highs.
Strong lows are lows that are able to break the previous swing high structure (BOS). It shows that demand is greater than supply, so bulls are in control. This works the other way as well for strong highs in a bearish market.
Strong lows are lows that are able to break the previous swing high structure (BOS). It shows that demand is greater than supply, so bulls are in control. This works the other way as well for strong highs in a bearish market.
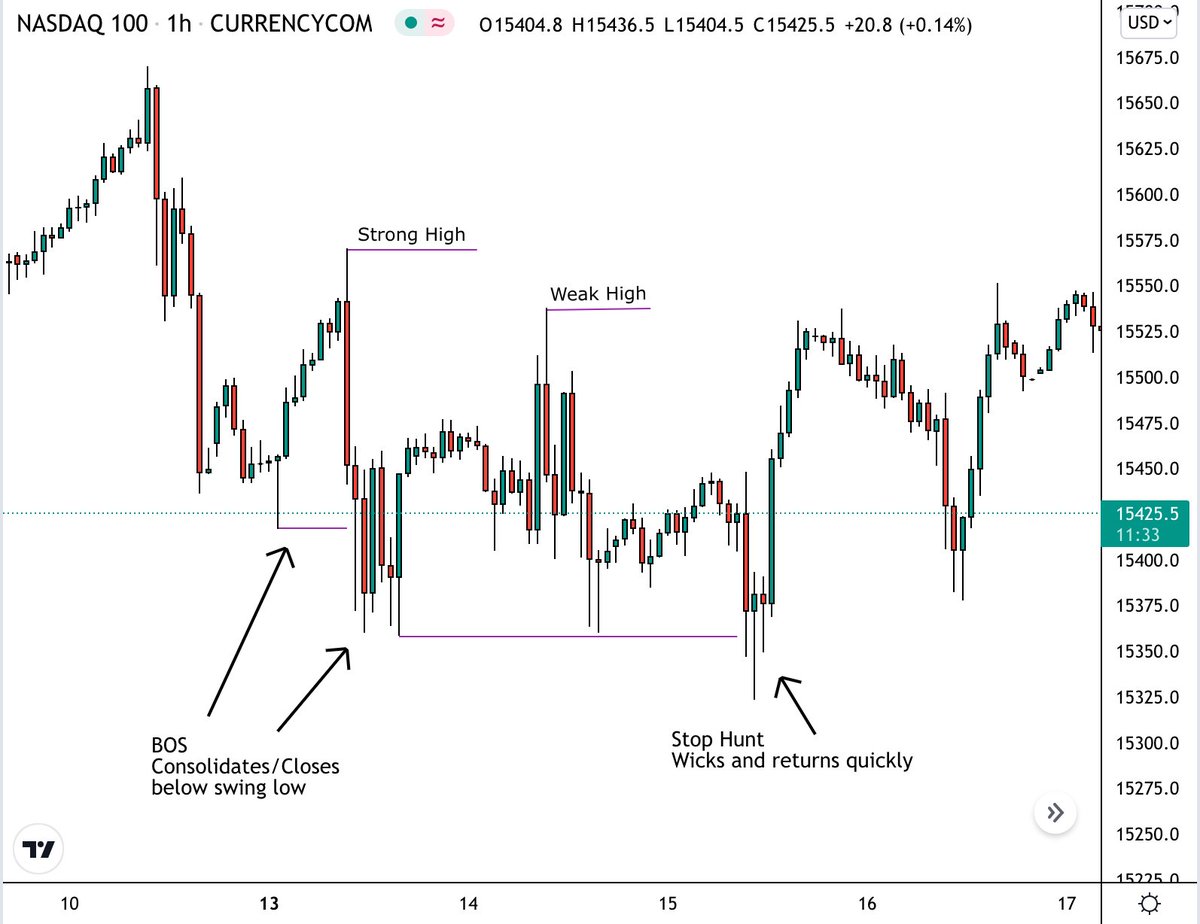
Break of Structure vs Stop Hunt
A BOS is a clear break and hold of a previous high. It validates the previous low as a STRONG low, meaning we can look for buys on a pull back toward its demand. A stop hunt is a spike above the high. Usually a wick depending on the time frame.
A BOS is a clear break and hold of a previous high. It validates the previous low as a STRONG low, meaning we can look for buys on a pull back toward its demand. A stop hunt is a spike above the high. Usually a wick depending on the time frame.
Look at the pic below. A strong high was caused because a BOS followed it. A weak high was formed because a SH followed it and it failed to Break structure below. This means we can expect price to potentially break the weak high but expect the strong high to hold.
IMPORTANT🚨
A strong low/high can only be made if it retraces AT LEAST 50% from the previous swing high/low. If it’s a more shallow retrace, it is not a low/high that I would recognize. I would call that LIQUIDITY $$$. Talking about that next…
A strong low/high can only be made if it retraces AT LEAST 50% from the previous swing high/low. If it’s a more shallow retrace, it is not a low/high that I would recognize. I would call that LIQUIDITY $$$. Talking about that next…
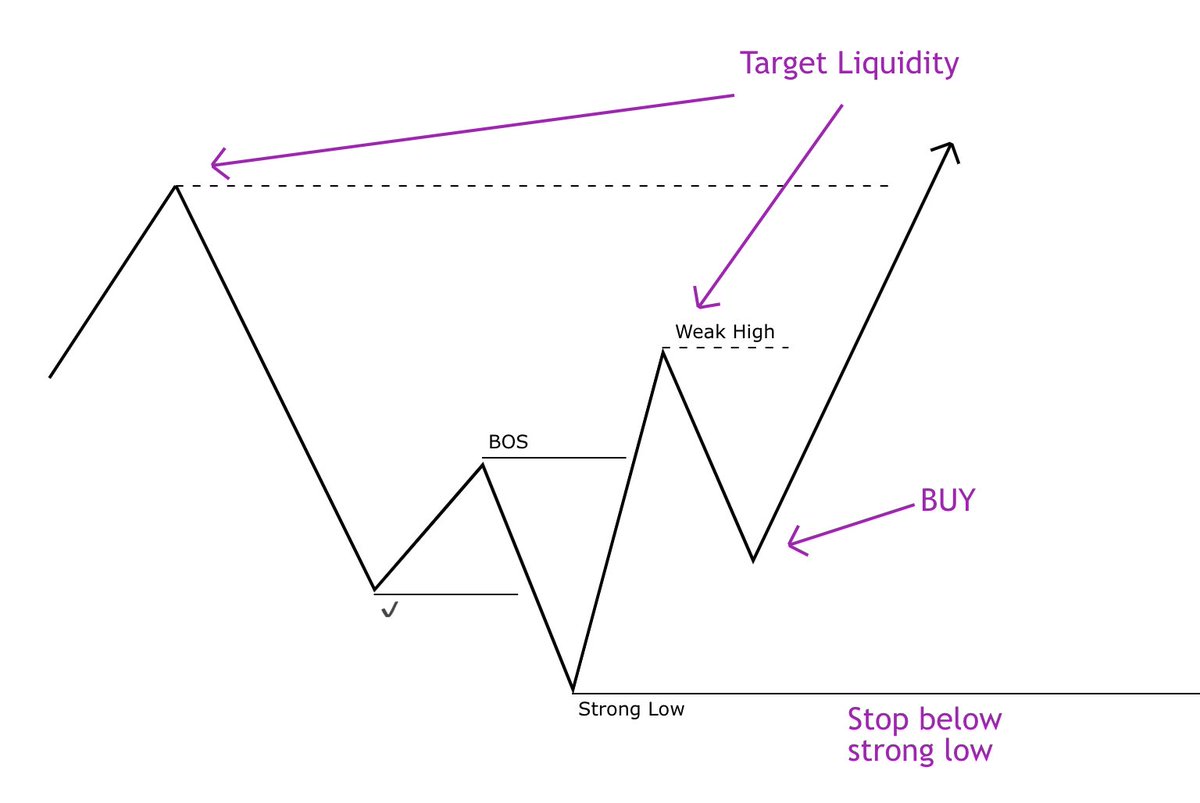
Liquidity!
The thing everyone talks about. Liquidity can be found above highs and lows. It’s where retail traders put their stops and where breakout traders use their market orders. Price is ALWAYS reaching for liquidity. It’s like a dog with its bone.
The thing everyone talks about. Liquidity can be found above highs and lows. It’s where retail traders put their stops and where breakout traders use their market orders. Price is ALWAYS reaching for liquidity. It’s like a dog with its bone.
When a low fails to be broken, expect price to reverse to the next high and vice versa. Price is simple. If there are too many buyers holding up a low, price will reverse and go up to a high to find liquidity.
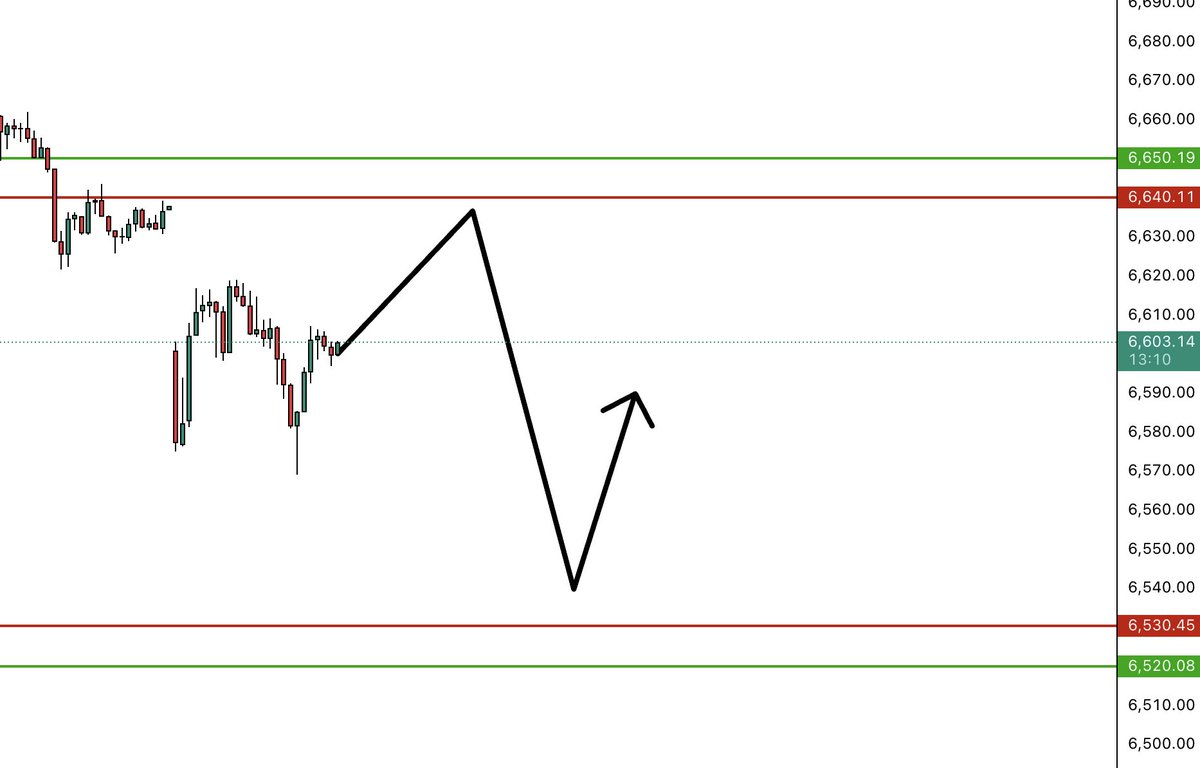
So what exactly is my trade plan?
It’s everything above! I look for long term uptrends and buy at demand zones and vice versa with shorts and supply zones. I look for a CHANGE IN TREND on the smaller time frame for confirmation to buy. THESE IMAGES ARE KEY 🔑
It’s everything above! I look for long term uptrends and buy at demand zones and vice versa with shorts and supply zones. I look for a CHANGE IN TREND on the smaller time frame for confirmation to buy. THESE IMAGES ARE KEY 🔑

Here is criteria I look for (Bullish scenario):
* Uptrend (Clear BOS)
* Retrace of at least 50%
* Smaller time frame Supply break (Change in trend)
* Smaller time frame retrace at least 50%
* Uptrend (Clear BOS)
* Retrace of at least 50%
* Smaller time frame Supply break (Change in trend)
* Smaller time frame retrace at least 50%
Here is typical Trade plan:
1. Entry is at 50% smaller time frame retrace (or demand)
2. Stop below swing low
3. Target 1 is STF swing high (cover 80%)
4. Target 2 is LTF swing high (cover all)
1. Entry is at 50% smaller time frame retrace (or demand)
2. Stop below swing low
3. Target 1 is STF swing high (cover 80%)
4. Target 2 is LTF swing high (cover all)
How to select options?
It all depends on time frame but when it doubt, go farther out! This is what I typically do for swing trades.
* ITM/ATM contracts
* 2-4 weeks out
* If Wednesday-Friday do 3 weeks minimum
It all depends on time frame but when it doubt, go farther out! This is what I typically do for swing trades.
* ITM/ATM contracts
* 2-4 weeks out
* If Wednesday-Friday do 3 weeks minimum
There are other topics I didn’t go over like Auction market theory, Fair Value Gaps, Market profile, Options strategies, etc. but this is a good mini lesson on what I look for in my trades. Now time for some tips!
Patience and Discipline are the two most important values when It comes to trading. Being able to follow your plan and not forcing trades are key (key emoji)
LESS IS MORE🔑
^ One of the most valuable tips my mentor gave me
LESS IS MORE🔑
^ One of the most valuable tips my mentor gave me
Risk/Reward. Almost EVERYONE says to have at least a 2:1 R/R. There is nothing wrong with that, but a 1:1 ratio works just fine. Don’t be greedy and go for 3R, or 4R trades. Find what works for you and TAKE PROFIT.
Withdrawal Profits from your account.
Everyone is trying to turn $1,000 into $100k. When you are starting out, DO NOT COMPOUND. Sizing up takes time and withdrawing profits from your account every week keeps you humbled and stops you from going overboard.
Everyone is trying to turn $1,000 into $100k. When you are starting out, DO NOT COMPOUND. Sizing up takes time and withdrawing profits from your account every week keeps you humbled and stops you from going overboard.
Well, I hope you enjoyed my thread.
Feel free to DM me with any questions!
Likes + RTs appreciated as always.
Ok, LETS PROFIT 🍾
#FT
Feel free to DM me with any questions!
Likes + RTs appreciated as always.
Ok, LETS PROFIT 🍾
#FT
• • •
Missing some Tweet in this thread? You can try to
force a refresh