Zach Goldberg Profile picture
Oct 29, 2021 7 tweets 3 min read Read on X
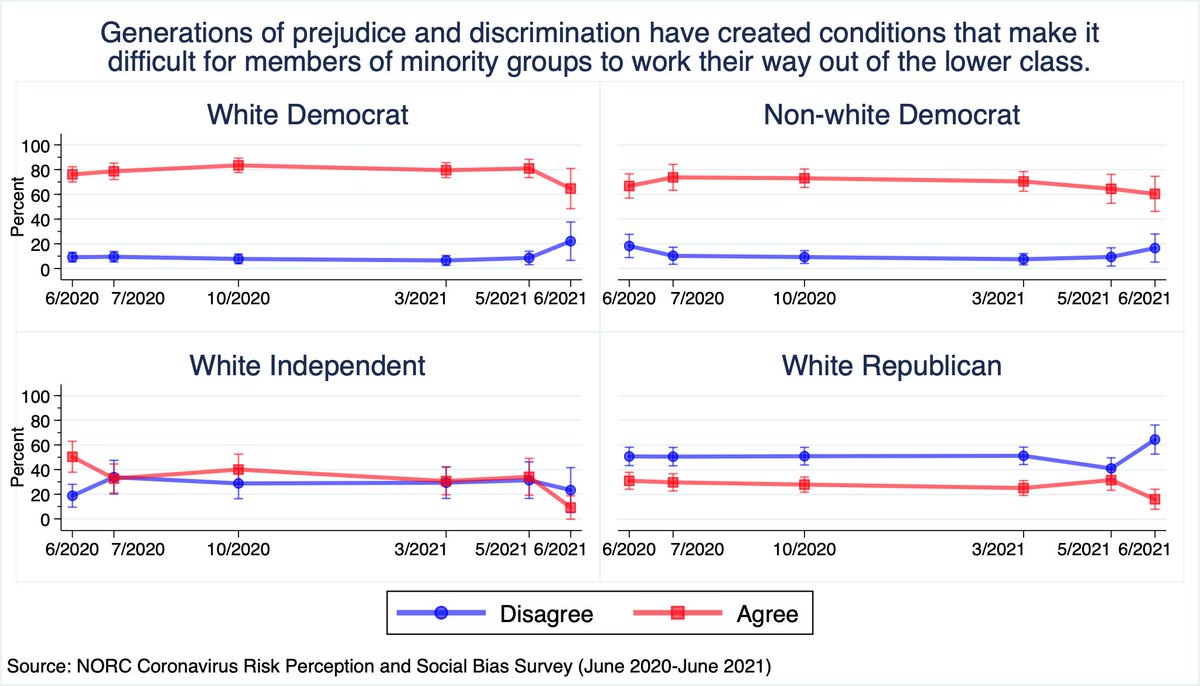
1/n Unless this is sampling bias, some signs that the Awokening has stalled--particularly among white independents. For instance, the share of white indeps that 'agreed' with the statement below *doubled* (33%->66%) between May and June (vs 59%->73% for white Reps).
2/n In contrast, the Awokening (at least on this question) persists among white Dems, with agreement *falling* (and disagreement increasing) 25%->14% across this same period.
3/n Similarly, the share that 'agree' that prejudice and discrimination holds back minorities fell nearly 25 points among white indeps (34%->9.2%) and 16 points mong white Republicans (31.7%->16.1%). Curiously, we also see a decline among white Dems (80.9%->64.7%)
4/n Combining and standardizing the two 5-point scales, we see general stability among white dems (likely because the changes cancel out) and non-white dems, and significant dips among white indeps and Reps.
5/n Of course, this could be sampling error. OR perhaps @realchrisrufo is just really good at what he does 🤔
6/n For those that'd like to see the results for racial/ethnic groups overall...
7/n I reverse-coded the scale (so it's now labeled 'racial conservatism') and combined the data for whites with the Google Trends series. Hard not to think there's a causal relationship here

• • •

Missing some Tweet in this thread? You can try to force a refresh
 

Keep Current with Zach Goldberg

Zach Goldberg Profile picture

Stay in touch and get notified when new unrolls are available from this author!

Read all threads

This Thread may be Removed Anytime!

PDF

Twitter may remove this content at anytime! Save it as PDF for later use!

Try unrolling a thread yourself!

how to unroll video
  1. Follow @ThreadReaderApp to mention us!

  2. From a Twitter thread mention us with a keyword "unroll"
@threadreaderapp unroll

Practice here first or read more on our help page!

More from @ZachG932

Dec 19, 2023
1/3 Most studies of the relationship between big 5 personality traits and political ideology examine the effects of broad or domain-level traits (e.g. 'Conscientiousness', 'Agreeableness'). However, the results of such studies can be misleading insofar as groups may have different or opposite scores on facets within those domain-level traits. For example, if liberals score higher than conservatives on the 'compassion' facet of agreeableness, and conservatives higher than liberals on the 'politeness' facet, these differences are likely to offset, resulting in a domain-level correlation with ideology that is small or indistinguishable from zero.

Given this issue, a relatively recent paper opted to examine the domain-level AND facet-level relationships with ideology. The chart below (you'll probably have to zoom in) visualizes/summarizes the estimates of these relationships.Image
2/3

Together, studies 1 and 2 found that A) the Openness (vs. Intellect) facet of Openness/Intellect (aka 'Openness to Experience) to be the strongest predictor of ideological liberalism. In fact, net of Openness, Intellect had no influence on ideology; B) after Openness, the 'Withdrawal' facet of Neurotism and the 'Compassion' facet of Agreeableness emerged as the 2nd and 3rd strongest positive predictors of ideological liberalism; and C) all facets of Conscientiousness were positively predictive of ideological conservatism, though the facet of 'Orderliness' showed a stronger relationship than that of 'Industriousness'; D) Some facets of extraversion appear to be mildly predictive of conservativism, which is interesting given that past studies have not found domain-level extraversion to be an ideologically-relevant trait.

Study 4, which utilized a different personality inventory, provides a substantive replication of these results: A) Aesthetic sensitivity, which is part of the 'Openness' facet, emerged as the strongest positive predictor of left-wing/liberal ideological orientations. Intellectual curiosity also has an independent positive influence, but one that is half the size of Aesthetic sensitivity; B) the Compassion and Respectfulness facets of Agreeableness were again positively predictive of left-wing/liberal and right-wing/conservative ideology, respectively; C) while comparatively more weakly, the Depression (and, to a smaller extent, Anxiety) facet of Neuroticism showed a significant positive association with left-wing/liberal ideology; D) All facets of consciousness were positively predictive of right-wing/conservative ideology, though 'Productiveness' was relatively more influential; E) Facets of Extraversion were again weak if significant predictors of ideology overall, though certain facets (e.g. Assertiveness) appear to point in the right-wing/conservative direction.
3/3

While interesting in their own right, I believe these findings could also have important implications for understanding the relatively poorer mental health of liberals vs. conservatives. Simply put--and for reasons I elaborate in a forthcoming paper--higher Neuroticism, higher Aesthetic sensitivity, higher empathic concern (closely related to Compassion), and lower Conscientiousness and Extraversion have all been previously identified as potential risk factors in the emergence of internalizing symptoms and disorders (depression, anxiety etc.). And, as it happens, liberals check off more of these boxes than conservatives.
Read 6 tweets
Nov 10, 2023
1/Strange. Palestinian Christians face the same oppressive occupation as their Muslim peers, and yet they are consistently vastly less likely to support acts of terrorism against Israeli civilians. Such a mystery. Image
2/2 Socioeconomic, geographic, and other demographic variables hardly explain the difference. Again, such a mystery. Wonder what it could be. Image
Whoops. Just noticed that 'attacks' is missing in the title of the first chart. My bad.
Read 4 tweets
Aug 10, 2023
1/ I'm thrilled to release my latest @ManhattanInst report, which presents findings from the most comprehensive study to date of public perceptual accuracy with respect to the prevalence and racial distribution of police use of force manhattan.institute/article/percep…
2/Until now, pretty much the only data we had on this topic was a 2021 @SkepResCenter survey, which featured a question that asked people to estimate the number of unarmed black men killed by police + the black share of deaths by police in 2019.
@SkepResCenter 3/ The current study goes MUCH further. It not only assesses the accuracy of people's perceptions of the overall prevalence of police use of lethal force and racial disparities therein, but also measures perceptual accuracy as it relates to (among other phenomena)..
Read 58 tweets
Jul 14, 2023
1/ Similarly (and relatedly), while there are a few widening sex differences among 12th-graders on measures of depression, self-esteem, life satisfaction, self-derogation, and loneliness... https://t.co/GYpBJcbfCY
Image
2/ ...the increasing ideological differences on these measures are far larger and more numerous Image
3/ To make this even clearer (and because many of these indicators were split-form/answered by sample subsets), I use Stimson's Dyadic Ratios algorithm (essentially a factor analysis of time series that adjusts for temporal interruptions between measures) to combine all of the..
Read 6 tweets
Mar 3, 2023
1/ Update of an earlier/2020 thread () with additional data+more groups: the median unarmed black police shooting victim now returns 21x the # of article results for a white victim, and 7-11x the # for Hispanic and 'other' (Asian, Native American) victims. Image
2/ 93% of black victims returned at least 1 article result vs. 60% of white, 70% of Hispanic, and 80% of 'other' victims. 40% of black victims were featured in at least 1 NYT article, as compared to 10% of white, 12% of Hispanic, and 10% of other victims.
3/Using the Stanford Cable TV News Analyzer, I also find that 26.2% of black victims were mentioned at least once on a CNN, MSNBC, or Fox News broadcast as compared to 4.9% of white, 2.2% of Hispanic, and 0% of other victims Image
Read 9 tweets
Mar 1, 2023
Schools might be a good place to start. None of this appears inevitable, at least by the data showcased in my and @epkaufm's latest @ManhattanInst report Image
See also this chart from the appendix Image
Unfortunately, black youth report the highest levels of CRT-related school exposure Image
Read 5 tweets

Did Thread Reader help you today?

Support us! We are indie developers!


This site is made by just two indie developers on a laptop doing marketing, support and development! Read more about the story.

Become a Premium Member ($3/month or $30/year) and get exclusive features!

Become Premium

Don't want to be a Premium member but still want to support us?

Make a small donation by buying us coffee ($5) or help with server cost ($10)

Donate via Paypal

Or Donate anonymously using crypto!

Ethereum

0xfe58350B80634f60Fa6Dc149a72b4DFbc17D341E copy

Bitcoin

3ATGMxNzCUFzxpMCHL5sWSt4DVtS8UqXpi copy

Thank you for your support!

Follow Us!

:(