Having built a haystack around school opening data, @ProfEmilyOster challenges readers to find the difference remote or in-person makes to community case rates. You can if you search, but first let's look at the haystack in which the difference is buried🧵 nature.com/articles/s4159…
The authors’ describe the study:
“The aim of this national, retrospective cohort study was to evaluate the impact of school mode and opening to in-person education on subsequent changes in community incidence of SARS-CoV-2.”
“The aim of this national, retrospective cohort study was to evaluate the impact of school mode and opening to in-person education on subsequent changes in community incidence of SARS-CoV-2.”

The school modes the authors consider are: traditional (in-person), virtual and hybrid. The authors conclude that learning modes make no statistically significant difference to incidence of Covid in a community.

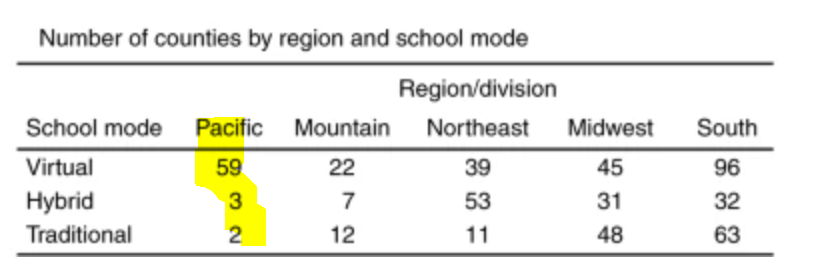
For purposes of the study, impact of learning modes is considered for 4 regions.

If you are wondering why they consider only 4 when there are 5 regions, the authors explain …. well, sort of because it’s the kind of explanation that raises more questions than answers. The authors tell us, “The Pacific division was excluded due to near uniform school mode..”

But why don’t the authors see the Pacific West’s uniformity of virtual learning as an opportunity to get a pure result, one unencumbered by the influence on community case rates of, say, the school just down the block that is doing in-person?
Of course, we need something to compare these Virtual counties to but the 3 Hybrid and 2 Traditional counties within that region aren’t nothing.
In fact, looking at the map, there seem to be glorious chunks of the US waiting to be carved up into discrete learning modes. For example, why not compare this bit of in-Person Texas
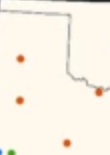
to this bit of virtual New Mexico? True, we are looking at a subset of the counties, but certainly this raises the possibility of taking the unit of comparison to be carve-outs of the US where learning modes were uniform across an area.

This should be possible. We know some of the country, mostly the south, continued in-person & obviously some of the country was largely remote. Why not compare these to each other? Certainly, there are confounders but those happen anyway when comparing counties within regions.
Further, it’s not as if the authors aren’t willing to navigate the treacherous territory of confounders.

If the authors’ are looking for the difference learning modes make, what is the point of taking counties with all their different learning modes happening right on top of each other & then trying to find a difference in case rates in a community that is influenced just as much by
the in-school classes down the block as it is by the in-person classes a mile away?
The Northeast coast is a case in point.
The Northeast coast is a case in point.

So is the Western Coast of Florida where in-person traditional classes are happening right on top of virtual classes with a hybrid or two thrown in for good measure.

How will you find a difference in the impact of remote on the community if the community you take as your point of contrast, also includes in-person?
Oh, wait.
Oh, wait.
Here’s a question: What if you didn’t want to find an impact? What if you wanted to show there’s little difference between virtual and in-person so you might as well do in-person; how would you design a study? What if the conclusion you hoped for was:
“After controlling for case rate trends before school start, state-level mitigation measures & community activity level, SARS-CoV-2 incidence rates were not statistically different in counties w/in-person learning versus remote school modes in most regions of the United States."
How would you get that conclusion?
Having looked at this study’s methods, I think I have a pretty good idea. The key is, not just in the decision to use pre-existing counties as the point of comparison, but also in how learning modes are assigned to counties.
Having looked at this study’s methods, I think I have a pretty good idea. The key is, not just in the decision to use pre-existing counties as the point of comparison, but also in how learning modes are assigned to counties.
To be clear, this is not an accusation that the authors are deliberately, or knowingly, rigging the game. But if you want to know what underpins this paper’s surprising claim that remote makes no difference to cases, that conclusion is in the methods.
As I said, counties are assigned learning modes. To describe how this is done, first, it’s going to sound complicated (if not crazy) but bear with me. I’m going to try to make it easy (but it will still be crazy).
To get a county’s learning mode, we have to start with districts. For districts, data from Burbio gives the proportion of schools using virtual, hybrid and in-person.

District data is converted to county data based on the proportion of learning modes considered across three grade levels. The learning mode present in the largest proportion is the learning mode of the county.

To see how this works, we start with a hypothetical county.

To assign a learning mode to our county, we take 3 grades. So as to have one from elementary, middle & high school, I’ll use 2nd, 7th & 11th grade.

Suppose the county has 5 districts each with an elementary, a middle & high school. Then we have 5 2nd grades, 5 7th & 5 11th grades. Each of the 5 2nd grades, each of the 5 7th grades & each of the 5 11th grades uses a learning mode.
Learning modes are represented by colors.
Learning modes are represented by colors.

Now fill the county with the 3 grades from the 5 Districts (Districts are rows across) and represent each learning mode proportionately based on the data.

Calculate the proportion (I’m doing out of 100) of each learning mode across grade levels.

Now calculate the average “grade level school modes.” For virtual the average is 33, for traditional in-person it's 47, and hybrid is 20.

Assign “the school mode for the county based on the maximum value of these averaged grade level school modes”. The maximum value is 47. The entire county’s learning mode is therefore traditional.


There sure is quite a bit of remote going on in a county designated as “Traditional In-Person".
That despite a county’s designation, it may contain other learning modes is admitted:

In fact, it is also admitted that counties could come close to, though they never approached, a 50-50 split (nor presumably a three-way tie).

All this suggests there isn’t anything particularly unlikely about my hypothetical county where traditional is predominant but not even a majority. In fact, traditional occurs more than Virtual only 14% of the time.
Further, if you consider Hybrid to be half-virtual (since half the school is virtual on any given day), then the difference between Virtual and Traditional is just 4 percentage points.
This very much matters as it’s reasonable to believe the presence of remote within an in-person county drives incidence rate down. Or, at the very least, that very plausible possibility is not ruled out when it should, at the very least, be considered as a limitation.
Nor is the dissolution of the impact of learning modes limited only to the presence of Virtual within In-person Counties. The opposite effect occurs too: Where it happens, in-person schooling may well be driving up the case rates in a county that gets labeled “remote”.
So while Virtual may well be keeping a lid on cases in counties that are designated “In-Person”, so too In-Person may be driving up cases is counties designated “Virtual”. You might say, they’d meet somewhere in the middle.
Despite all this, & despite the authors' claim differences in learning modes are “statistically insignificant” wrt cases, the impact is there to see.
Time after time, cases for virtual are lower & almost never higher.
How can that be insignificant?
Time after time, cases for virtual are lower & almost never higher.
How can that be insignificant?
https://twitter.com/bXLpedestrian/status/1453443866821025795
This study reminds me of painting with my kids who never cleaned brushes btw colors. Yellow would make it’s way to blue which made it’s way to red & etc. I’d paint with the yellow pot of paint, but the color on the paper would be brown.
I’d paint with the red pot, but the color on the paper would be brown. All the pots looked the same on paper: brown. There’s a lesson here for the authors. If you want to see the difference virtual makes, you can’t muddy it up with in-person.
If you do, don’t be surprised when everything looks the same. My advice: Look west where the colors, and the results, are purer.
• • •
Missing some Tweet in this thread? You can try to
force a refresh