
Uncertainty in using CO2 for ventilation clues in Classrooms.
A LONG Thread... 1/
A LONG Thread... 1/
Short version:
High CO2: REAL BAD.
Low CO2: Meh...
In Between: Who knows... better get filtering.
2/
High CO2: REAL BAD.
Low CO2: Meh...
In Between: Who knows... better get filtering.
2/
First lets talk about short versus long range transmission.
1) The highest COVID transmission risk is short range where the aerosols are highest in concentration. Well fitting masks and distancing are the best defense. 3/
1) The highest COVID transmission risk is short range where the aerosols are highest in concentration. Well fitting masks and distancing are the best defense. 3/
2) But COVID laden aerosols can build up in poorly ventilated spaces, creating long range transmission risk throughout a room. Poorly ventilated spaces are where superspreading events occur. 4/
What we are trying to due with CO2 monitoring is find the poorly ventilated classrooms, before a person who is highly emitting viruses enters. Then we can fix these classrooms before they become superspreading events. 5/
In addition, classrooms with higher ventilation (lower CO2) have demonstrated decreased absenteeism and increased student performance. So we get ancillary benefits from fixing poorly ventilated classrooms! 6/
So, where does classroom CO2 come from? Your lungs exchange oxygen in air with carbon dioxide. Importantly, the amount of carbon dioxide that we emit depends on our sex, age, activity level and size. The air you breathe in is about 0.04 % carbon dioxide. 7/ 

The air you breathe out is about 4 % carbon dioxide.
Given its relatively high concentration and ease of measurement compared to other chemicals and emissions from people, carbon dioxide is a good proxy of potential emissions from humans (e.g. viruses). 8/
Given its relatively high concentration and ease of measurement compared to other chemicals and emissions from people, carbon dioxide is a good proxy of potential emissions from humans (e.g. viruses). 8/
Let's stop here and say it again. CO2 does not equal IAQ (Indoor Air Quality). It is important to note the CO2 is only a proxy for human emissions and many other things impact our indoor air quality. 9/
Building materials, furniture, cleaning supplies, indoor chemical reactions and outdoor contaminants all impact indoor air quality. Hence, low indoor CO2 concentrations do not necessarily indicate good indoor air quality. 10/
Lets start by talking about CO2 monitor uncertainty. The most accurate consumer grade sensors are Non-Dispersive Infrared (NDIR). The infrared light passes through the air and carbon dioxide molecules absorb a specific frequency. 11/
poppendieck.com/IAQ/Consumer%2…
poppendieck.com/IAQ/Consumer%2…
A detector determines the fraction of that specific frequency of infrared light that has passed through the sample. The fraction that passes through the sample is proportional to carbon dioxide concentration. 12/
Monitors using sensors other than NDIR can have errors depending on the calibration chemical. Although NDIR sensors report values to three or four digits they are only accurate to roughly +/- 50 ppmv. 13/
Finally, these sensors can drift over time. However, the sensors are typically linear so the the difference between the indoor and outdoor CO2 concentrations is typically fairly consistent for sensors. 14/
So the bottom line is that a CO2 reading of 900 ppmv could be 850 ppmv or 950 ppmv. In the real world a room hitting 4000 ppmv is bad, it doesn't matter if it is 3950 ppmv or 4050 ppmv. 15/
When we use CO2 as a ventilation clue, we need to make sure non-human sources of CO2 are not present, such as indoor combustion or vehicles idling outside air intakes. 16/
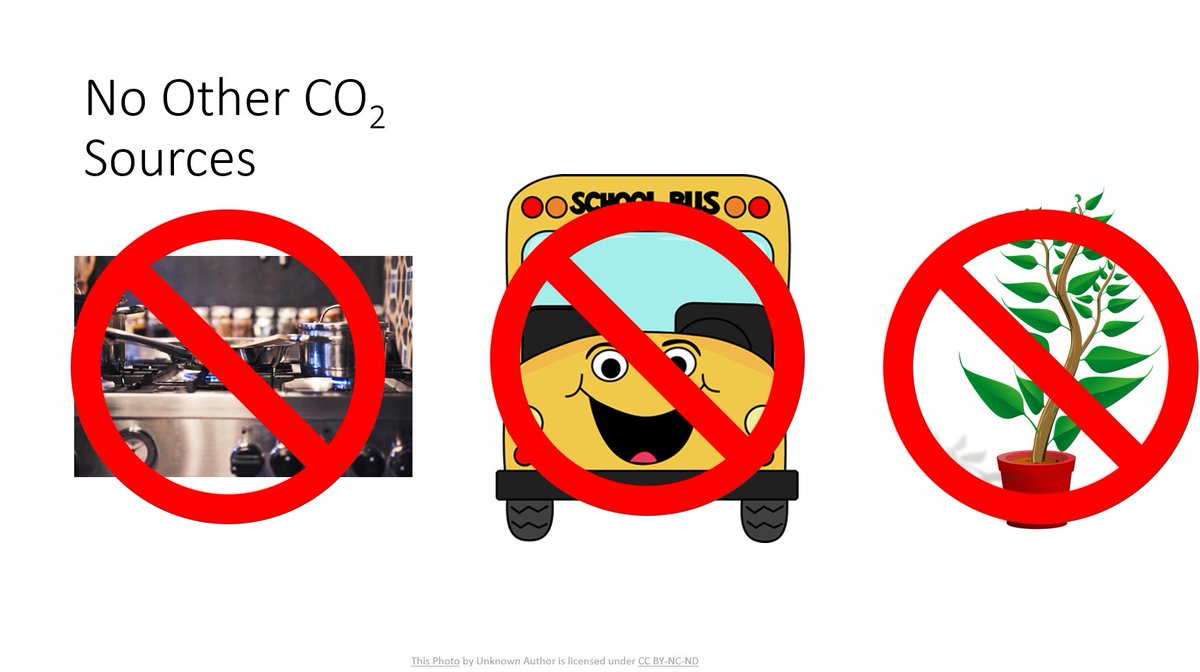
We also need to make sure we don’t have significant CO2 removal mechanisms like specialty filters or a significant number of plants (greenhouse level). 17/
So how do we use CO2 to identify poorly ventilated classrooms?
There are three potential approaches. The first deals with how much air we rebreathe that has been previously been in other people’s lungs. 18/
There are three potential approaches. The first deals with how much air we rebreathe that has been previously been in other people’s lungs. 18/

We can use CO2 to determine the fraction of air you are breathing that you are rebreathing. For instance, if the average indoor carbon dioxide concentration is 820 ppmv (820 carbon dioxide molecules per 1 million total air molecules) and the outdoor concentration is 420 ppmv 19/

and the exhaled concentration is 40,000 ppmv, then 1 % of every breath a person takes in the room will consist of air that has been in someone’s lungs. If the indoor concentration is 3620 ppmv, then 8 % of every breath a person takes in the room will consist of air that has. 20/
in someone’s lungs (or 8 times higher than if the average indoor concentration was 820 ppmv). 21/
For airborne viruses we want to keep that rebreathed fraction, as indicated by the CO2 concentration, as low as possible. The lower the rebreathe fraction, the lower the overall risk that IF there is a COVID19 emitter present, that you will inhale COVID19 laden particles. 22/
A second approach to use CO2 readings from a classroom is by examining the maximum daily CO2 concentration when the space is used at normal OCCUPANCY. 23/

To determine the maximum CO2 concentration in a classroom, place the sensor outside for five minutes to ensure reasonable readings (typically 400 - 550 ppmv). Make sure the room to be measured is occupied with normal occupants/use patterns but has no non-human CO2 sources. 24/
Locate the sensor in the middle of the room. Log the data for a full day. Ventilation changes depending on windows, season, weather, thermal loads and HVAC operation, so repeat the measurement on a regular schedule. 25/
Carbon dioxide concentrations will build up in the classroom over time when students are present and drop when they are absent. This is why you can’t just take one measurement at one point during the day, rather data needs to be logged for the day. 26/
In this case, you can see when kids entered the room, went out for recess, and the peak concentration all of which would all give very different single point readings. The data of interest is the highest average value over approximately 15 minutes. 27/

In this case about 1200 ppm or 800 ppm above the outside concentration. These data come from a portable classroom was at 2100 ppm before the teacher was given the monitor. They actively open the windows and doors to reduce the CO2. 28/
So how can we use the maximum CO2 concentration in the classroom to get an idea of the ventilation rate?
We can model what the CO2 concentration SHOULD BE under typical (or the designed) classroom use. 29/
We can model what the CO2 concentration SHOULD BE under typical (or the designed) classroom use. 29/
To do this we need to know the 1) volume of the space. 2) the designed ventilation rate, and 3) the numbers, sex, age, average weight and activity level of students and teachers. The activity level (or met level) is a description of how much the people in the room move .. 30/

and their energy use. This rate can very a lot, leading to uncertainties in the model.
Other assumptions in modeling rooms this way include the steady state assumption for occupation and ventilation ate. 31/
Other assumptions in modeling rooms this way include the steady state assumption for occupation and ventilation ate. 31/
While not great for all spaces, this assumption is reasonable for classroom activities, numbers of kids present. Even if the space never reaches steady state, high maximum values can be used to indicate problem spaces.
32/
32/
Another issue is that the model assumes all air entering the space from outside, like hallways and adjoining classrooms. While this maybe true for portable classrooms, it is not in school buildings and which will under or overpredict classroom CO2 concentrations. 33/
NIST has a web-based single zone mass balance tool that allows the user to determine what the CO2 concentration would be in a range of school density and activity scenarios IF the room was operating as designed.
pages.nist.gov/CONTAM-apps/we…
34/
pages.nist.gov/CONTAM-apps/we…
34/
In the tool you can enter a number of parameters including the up to two ventilation rates and activity level for each occupant. 35/

The model output is then the CO2 concentration increasing with time, including the maximum concentration reached. It is important to note that currently concentrations are in mg/m3 (SI unit) and not ppm as reported on most consumer grade CO2 meters. 36/

On this graph we can see how the CO2 concentration is a function of the ventilation rate. For all cases the class size, students, and activity levels are held constant. At high ventilation rates (greater than the ASHRAE requirements shown in the black line), the maximum CO2..37/

concentration is reached relatively quickly in the first 1-2 hours at a relatively low level. In this example, the low ventilation rates the concentration may continue to rise all day, reaching concentrations three times higher than when ASHRAE guideline ventilation was met. 38/
We can use this graph to see, that if this classroom hit 1250 ppmv after two hours, likely it would not be meeting ASHRAE ventilation rates, which were developed without a focus on airborne pandemic transmission. 39/
Likewise, if the CO2 concentration is still rising at 3 hours of uninterrupted occupation, then it also would not likely be meeting pre-pandemic ventilation rates, as higher ventilation rates would have already reached stable concentrations. 40/
Here is an example of a real classroom where the CO2 concentration is still rising at 3 hours of uninterrupted occupation, despite only having a maximum CO2 concentration of 1600 ppmv it would not likely not be meeting pre-pandemic ventilation rates. 41/

However, if the room was below 800 ppmv after four hours, in this case it would be meeting pre-pandemic ventilation rates. 42/

We can summarize the relationship between ventilation rates and the maximum steady state CO2 concentration in a classroom with this chart for 34 14 year old students in a 100 m2 classroom. The purple line shows potential maximum CO2 concentrations when the students and ..43/

teacher have minimal activity (low met values). The green line shows the same potential maximum CO2 concentrations when the students and teacher have a higher activity levels. Notice that if the room was operating at the ASHRAE requirement of 6.7 L/s/p the maximum CO2.. 44/
concentration could be anywhere from 800 ppmv to 1250 ppmv depending only on the activity levels of the occupants. 45/
We can do the same analysis for 24 7-year-olds in a 100 m2 classroom. In this case if the room was operating at the ASHRAE requirement of 7.4 L/s/p the maximum CO2 concentration could be anywhere from 685 ppmv to 950 ppmv depending on the activity level of the students.46/

Overlaying these two rooms gives a sense of the uncertainty in the model due to activity level, age and number of students. Despite this uncertainty, high maximum daily CO2 readings are indicative of low outdoor ventilation rates. 47/

If the maximum daily CO2 readings are below 700 ppm we can be fairly confident the ventilation rates are high, especially if reading are repeated over multiple days. 48/
If the maximum daily CO2 readings are above 2000 ppmv we can be fairly confident the ventilation rates are low and the rooms ventilation system should inspected and/or addressed. These are the classrooms we are trying to find using CO2 measurements. 49/
The range between these values gives us less conclusive information on the state of the ventilation as the model assumptions (age/weight/size/activity level/steady state) all impact the conclusions we can draw from of the data. 50/
Here is an example of using a CO2 monitor to demonstrate a poorly ventilated classroom this year by @jeremychrysler . After collecting several days of similar data, it was discovered that there were two faulty air handlers. 51/
https://twitter.com/jeremychrysler/status/1427812197657366535
The moral of story is if maximum CO2 concentrations are 2000-5000 ppm steps can and should be immediately taken. Including checking equipment, evaluating the room use (density and activity levels are at design targets) and... 52/
ensure there are no other CO2 sources complicating the analysis. While these steps should be immediately taken in poorly ventilated classrooms, they should also be done a regular basis for all classrooms. 53/
There is a third way we can use CO2 concentrations to evaluate ventilation. We need to raise the CO2 concentration (either with students, dry ice, soda stream canisters or other means) and then let the CO2 concentration decay with no people or CO2 sources present. /54

This approach has been used for almost a century and is highlighted in ASTM E741. In this case, we can look at the room air associated same data as before. I know that the first big drop occurred when the students left the room to afternoon recess and the windows were open./55

The second slower decay occurred when all the doors and windows were closed after hours. The classroom was operated pre-pandemic with the doors and windows closed. /56
We can do some fun math keeping track of the CO2 molecules in what is called a mass balance approach. This is much like standing at the front of the store and determining the number of people in the store by counting how many enter and leave rather than running around /57

constantly counting who is in the store. Once we have solved the mass balance (math on the left), we can solve for the CO2 decay rate. Plotting the logarithmic expression versus time, results in a slope that is the CO2 decay rate. In this case the decay rate is 2 per hour. /58
There is lots of uncertainty with this approach including:
Curve fit errors.
The decay rate will depend on weather, especially is natural ventilation (windows are involved).
Like previous maximum concentration approach this method assumes all air entering the space ../59
Curve fit errors.
The decay rate will depend on weather, especially is natural ventilation (windows are involved).
Like previous maximum concentration approach this method assumes all air entering the space ../59
comes from outside, rather than hallways/other classrooms.
But using this approach the CO2 decay rate for the building can be used as an estimate of the air change rate for portable classrooms. /60
But using this approach the CO2 decay rate for the building can be used as an estimate of the air change rate for portable classrooms. /60
Such as shown here. The decay WITH the windows open was 1/ h. When the room was shut it lowered to 0.2/h. For this portable classroom these CO2 decay rates are reasonable approximations of the air change rate as all entering air came from outside. /61

This classroom was supplemented with three portable air filters each with roughly 1.5/h effective air change rates on maximum setting and an occasional window exhaust fan. /62
Remember ventilation is only one part of the equation to mitigate long range COVD19 transmission. Portable and central air handling filtration also play an important role and do not impact the CO2 concentration. The 5-6 eACh recommendations includes all particle removal /63

processes. The effects of each process are additive in particle removal, and we can add them together to get the effective air change rate. /64
Once you have values for ventilation, portable and HVAC filtration (typically MERV13), you can apply the appropriate conversion to get them in the same eACH units. Ventilation can be reported in L/s/person or CFM/person. /65

Note the reported Clean Air Delivery Rate (CADR) is only the maximum setting and must be adjusted lower if the highest setting is not used. For some configurations, HVAC flows to a room can be measured using a balometer. /66
Note this method assumes that the particles are too small to significantly deposit to indoor surfaces in a relevant time frame. /67
Are you still reading? wow... /68
Bottom lines:
CO2 concentrations in classrooms vary. Measurements should be repeated as season and HVAC system operation change.
Measurements provide actionable data that district, schools and teachers can use to minimize risk. /69
CO2 concentrations in classrooms vary. Measurements should be repeated as season and HVAC system operation change.
Measurements provide actionable data that district, schools and teachers can use to minimize risk. /69
High values should initiate immediate investigative actions to address potential issues. Low values are not a guarantee of no risk, but are safer than higher values. /70
Open access to CO2 data can build trust between the school community and building operators. Open data allows the targeting of community resources to address problematic spaces. /71
Finally, classrooms with higher ventilation levels have demonstrated decreased absenteeism and increased student performance. Increasing ventilation for COVID reasons can lead to long term benefits for students and teachers. / 72
Thank you for coming to my little talk. I hope it helps you interpret CO2 data from classrooms. If you want to share a video version of this you can find it here:
healthandenvironment.org/webinars/96581
healthandenvironment.org/webinars/96581
• • •
Missing some Tweet in this thread? You can try to
force a refresh


