
Building an event-driven, reliable serverless application is a difficult task 👨💻
What's also challenging: monitoring your ever-growing ecosystem of functions ƛ
My 𝘂𝗹𝘁𝗶𝗺𝗮𝘁𝗲 𝗴𝘂𝗶𝗱𝗲 𝘁𝗼 𝗺𝗼𝗻𝗶𝘁𝗼𝗿𝗶𝗻𝗴 𝘀𝗲𝗿𝘃𝗲𝗿𝗹𝗲𝘀𝘀 𝗮𝗽𝗽𝘀
↓
What's also challenging: monitoring your ever-growing ecosystem of functions ƛ
My 𝘂𝗹𝘁𝗶𝗺𝗮𝘁𝗲 𝗴𝘂𝗶𝗱𝗲 𝘁𝗼 𝗺𝗼𝗻𝗶𝘁𝗼𝗿𝗶𝗻𝗴 𝘀𝗲𝗿𝘃𝗲𝗿𝗹𝗲𝘀𝘀 𝗮𝗽𝗽𝘀
↓
𝗧𝗵𝗿𝗲𝗮𝗱 𝗢𝘃𝗲𝗿𝘃𝗶𝗲𝘄 🧵
• Problem Statement
• What to Monitor?
• Performance Monitoring
• Costs & Usage
• Monitoring Tools
• Benefits of Serverless Monitoring
{ 1/28 }
• Problem Statement
• What to Monitor?
• Performance Monitoring
• Costs & Usage
• Monitoring Tools
• Benefits of Serverless Monitoring
{ 1/28 }
Serverless architectures bring us a lot of known benefits:
• less operation overhead
• only paying for actually used resources
• reduced cycle times due to small, often independent deployment units
• instant scaling
... and much more.
{ 2/28 }
• less operation overhead
• only paying for actually used resources
• reduced cycle times due to small, often independent deployment units
• instant scaling
... and much more.
{ 2/28 }
As for everything, there's not only the bright side but also some trade-offs, like setting up proper monitoring.
There are a lot more units to monitor, the life cycles are short & configuring agents directly contributes to latency and cost.
{ 3/28 }
There are a lot more units to monitor, the life cycles are short & configuring agents directly contributes to latency and cost.
{ 3/28 }
Before digging into how to solve our monitoring dilemma, let's go one step back: what do we even 𝗻𝗲𝗲𝗱 𝘁𝗼 𝗠𝗼𝗻𝗶𝘁𝗼𝗿 𝗳𝗼𝗿 𝘀𝗲𝗿𝘃𝗲𝗿𝗹𝗲𝘀𝘀 𝗮𝗽𝗽𝗹𝗶𝗰𝗮𝘁𝗶𝗼𝗻𝘀?
For gaining maximum benefit of serverless: latency, cold starts, errors, cost & usage.
{ 4/28 }
For gaining maximum benefit of serverless: latency, cold starts, errors, cost & usage.
{ 4/28 }
𝗟𝗮𝘁𝗲𝗻𝗰𝘆 𝗠𝗼𝗻𝗶𝘁𝗼𝗿𝗶𝗻𝗴
Large data sets can make it hard to notice a small performance drop for some user-facing function calls, as average metrics quickly hide outliers.
We need to keep an eye on mission-critical functions & observe for outliers.
{ 5/28 }
Large data sets can make it hard to notice a small performance drop for some user-facing function calls, as average metrics quickly hide outliers.
We need to keep an eye on mission-critical functions & observe for outliers.
{ 5/28 }
Regarding 𝗦ervice 𝗟ayer 𝗔greements, we're often facing .𝟵𝟵 requirements, which mean that 99% of requests can't exceed a given threshold.
Having a noticeable set of outliers can quickly burst through such requirements if not watched carefully.
{ 6/28 }
Having a noticeable set of outliers can quickly burst through such requirements if not watched carefully.
{ 6/28 }
𝗖𝗼𝗹𝗱 𝗦𝘁𝗮𝗿𝘁𝘀
If a function instance is provisioned, a new micro-container is started by AWS. This takes time and drastically increases the latency for this request.
Even worse: for a burst of parallel requests, there's a need for multiple containers.
{ 7/28 }
If a function instance is provisioned, a new micro-container is started by AWS. This takes time and drastically increases the latency for this request.
Even worse: for a burst of parallel requests, there's a need for multiple containers.
{ 7/28 }
That's because a function instance is only able to compute one request at a time
It's important to track the number of cold starts so you can take architectural improvements if necessary, as there are a lot of possible measures to improve customer-facing cold-starts
{ 8/28 }
It's important to track the number of cold starts so you can take architectural improvements if necessary, as there are a lot of possible measures to improve customer-facing cold-starts
{ 8/28 }
𝗜𝗻𝘃𝗼𝗰𝗮𝘁𝗶𝗼𝗻 𝗘𝗿𝗿𝗼𝗿𝘀
There are a variety of reasons why a Lambda invocation can raise an error.
Such errors will return an HTTP 4xx or 5xx - so the invocation is rejected before the function receives it.
Surely, those are not the only possible problems.
{ 9/28 }
There are a variety of reasons why a Lambda invocation can raise an error.
Such errors will return an HTTP 4xx or 5xx - so the invocation is rejected before the function receives it.
Surely, those are not the only possible problems.
{ 9/28 }
Outgoing calls to 3rd parties can fail without anybody noticing or rate limits are exceeded. Finding out what the actual bottleneck is can be difficult.
Notifications of failures & pinpointing where & when the error happened will save hours and reduce downtimes.
{ 10/28 }
Notifications of failures & pinpointing where & when the error happened will save hours and reduce downtimes.
{ 10/28 }

𝗖𝗼𝘀𝘁𝘀 𝗮𝗻𝗱 𝗨𝘀𝗮𝗴𝗲
Your Lambda bill is built through three different factors:
• number of requests
• compute time
• provisioned memory
It drills down to 𝗚𝗕-𝘀𝗲𝗰𝗼𝗻𝗱𝘀, which means how many seconds a function with 1 GB allocated memory was running.
{ 11/28 }
Your Lambda bill is built through three different factors:
• number of requests
• compute time
• provisioned memory
It drills down to 𝗚𝗕-𝘀𝗲𝗰𝗼𝗻𝗱𝘀, which means how many seconds a function with 1 GB allocated memory was running.
{ 11/28 }
The first bill is charged after 400,000 GB-seconds, as this is the free tier limit.
For this, you can run a 128MB function for the whole month without interruptions, but a 1GB function for less than 5 days.
{ 12/28 }
For this, you can run a 128MB function for the whole month without interruptions, but a 1GB function for less than 5 days.
{ 12/28 }
As you're generally not only using Lambda, there are also costs for other Services like S3, DynamoDB, or SNS.
While your app is growing rapidly, it's easy to lose track of what's been spent & what resources have been used efficiently and intentionally.
{ 13/28 }
While your app is growing rapidly, it's easy to lose track of what's been spent & what resources have been used efficiently and intentionally.
{ 13/28 }
𝗠𝗼𝗻𝗶𝘁𝗼𝗿𝗶𝗻𝗴 𝗧𝗼𝗼𝗹𝘀
Looking at the problem statement, it's easy to see that there's a need for tracing all of those areas. Running an app on blindsight won't work for a very long time.
Let's have a look at what AWS brings & how it compares to Dashbird.
{ 14/28 }
Looking at the problem statement, it's easy to see that there's a need for tracing all of those areas. Running an app on blindsight won't work for a very long time.
Let's have a look at what AWS brings & how it compares to Dashbird.
{ 14/28 }
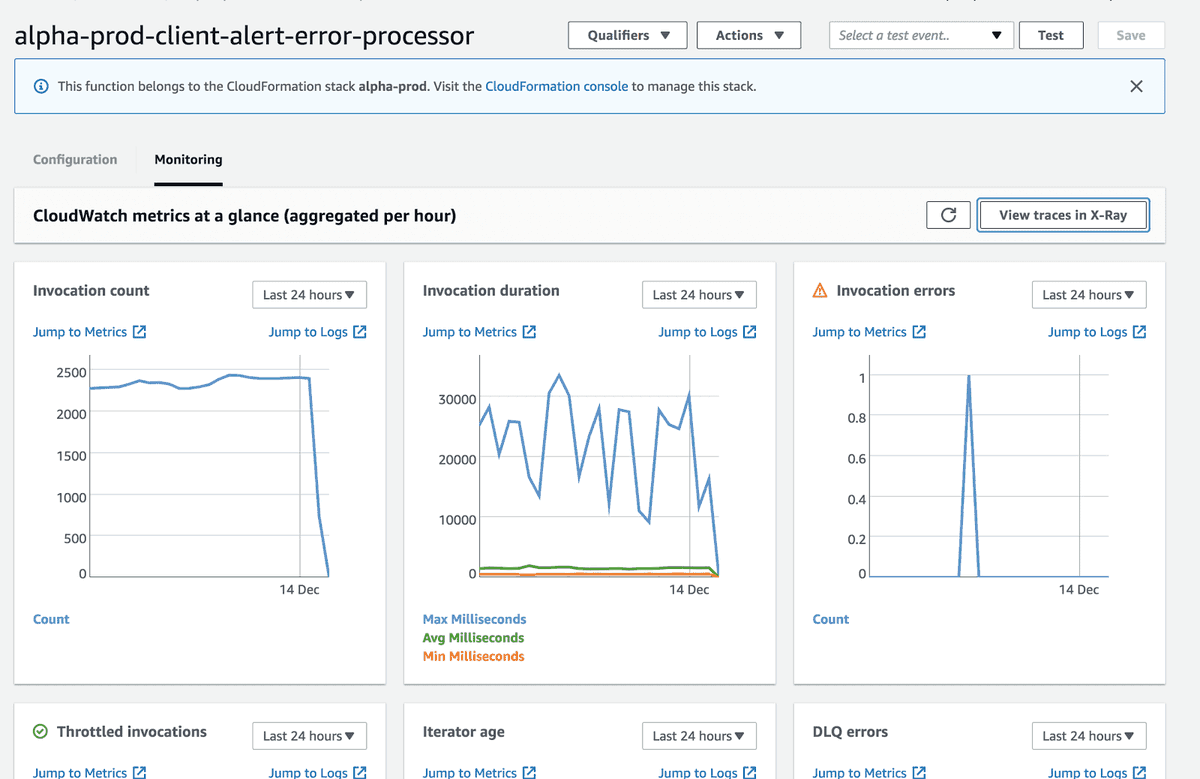
𝗔𝗪𝗦 𝗖𝗹𝗼𝘂𝗱𝗪𝗮𝘁𝗰𝗵
What's already in the box: your functions logs are collected at streams in groups per function. Additionally, CloudWatch collects metrics that can also be collected in Dashboards.
Even more: you can set up alerts for metric alarms.
{ 15/28 }
What's already in the box: your functions logs are collected at streams in groups per function. Additionally, CloudWatch collects metrics that can also be collected in Dashboards.
Even more: you can set up alerts for metric alarms.
{ 15/28 }
With alarms, you'll be notified if predefined thresholds are exceeded.
CloudWatch is a good starting point for your first FaaS application. The more your landscape grows and the more request volume your app receives, you'll need a more comprehensive tool.
{ 16/28 }
CloudWatch is a good starting point for your first FaaS application. The more your landscape grows and the more request volume your app receives, you'll need a more comprehensive tool.
{ 16/28 }
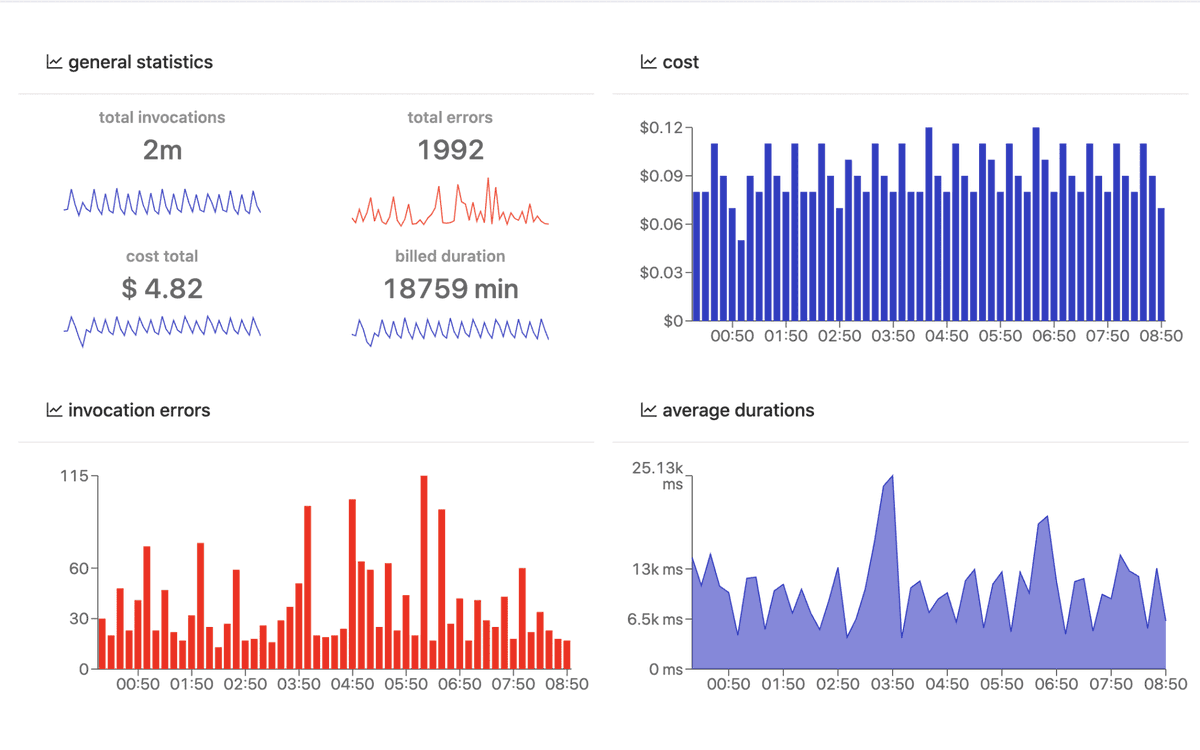
Dashbird.io provides enhanced error alerting & observability for everything around AWS Lambda but doesn't affect performance or costs, as it gathers logs & metrics through AWS APIs
It starts by providing a great high-level overview of your app's health
{ 17/28 }
It starts by providing a great high-level overview of your app's health
{ 17/28 }
You can drill down into invocation level data to analyze individual functions.
Services that are closely related to Lambda and widely used are also covered: DynamoDB, SQS, API Gateway, Kineses, Step Functions & ECS.
{ 18/28 }
Services that are closely related to Lambda and widely used are also covered: DynamoDB, SQS, API Gateway, Kineses, Step Functions & ECS.
{ 18/28 }
Furthermore, the Well-Architected Lens helps to find potential issues & implement best practices.
{ 19/28 }
{ 19/28 }
𝗜𝗻𝘀𝘁𝗮𝗻𝘁 𝗕𝗲𝗻𝗲𝗳𝗶𝘁𝘀 𝗼𝗳 𝗦𝗲𝗿𝘃𝗲𝗿𝗹𝗲𝘀𝘀 𝗠𝗼𝗻𝗶𝘁𝗼𝗿𝗶𝗻𝗴
There are a lot of benefits at the first glance: you'll save a lot of time debugging and generally have a more productive business, team & application.
But that's not all.
{ 20/28 }
There are a lot of benefits at the first glance: you'll save a lot of time debugging and generally have a more productive business, team & application.
But that's not all.
{ 20/28 }
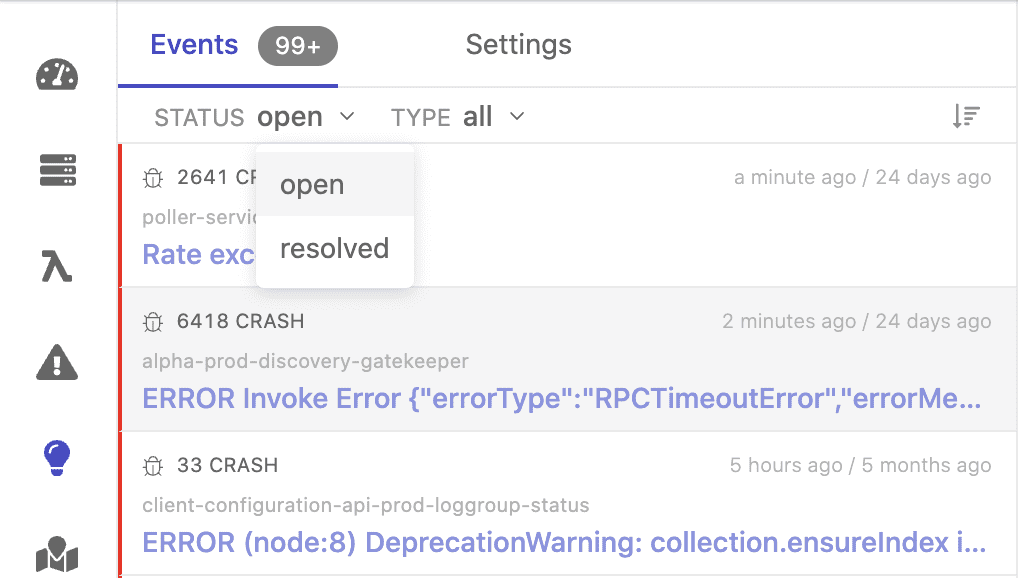
𝗜𝘀𝘀𝘂𝗲 𝗠𝗮𝗻𝗮𝗴𝗲𝗺𝗲𝗻𝘁 𝗮𝗻𝗱 𝗧𝗲𝗮𝗺 𝗖𝗼𝗹𝗹𝗮𝗯𝗼𝗿𝗮𝘁𝗶𝗼𝗻
Regardless of how well your app is built, it will generate a reasonable amount of issues on a frequent basis.
Those issues need to be tracked, visualized, and managed in an efficient way.
{ 21/28 }
Regardless of how well your app is built, it will generate a reasonable amount of issues on a frequent basis.
Those issues need to be tracked, visualized, and managed in an efficient way.
{ 21/28 }
There needs to be a friendly way of displaying open, resolved, and temporarily muted issues so that the team collaborates better due to a clear way of communicating their resolution workflow.
{ 22/28 }
{ 22/28 }
𝗤𝘂𝗮𝗹𝗶𝘁𝘆 𝗧𝗿𝗮𝗰𝗸𝗶𝗻𝗴
A quick way of visualizing past occurrences of the same issue can be important as some cases require further investigation.
They may indicate that fixing approaches didn't work out as expected
It also helps to avoid the same mistakes
{ 23/28 }
A quick way of visualizing past occurrences of the same issue can be important as some cases require further investigation.
They may indicate that fixing approaches didn't work out as expected
It also helps to avoid the same mistakes
{ 23/28 }
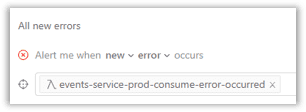
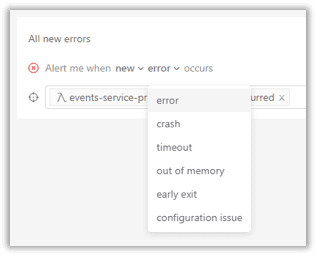
𝗘𝘃𝗲𝗻𝘁-𝗗𝗿𝗶𝘃𝗲𝗻 𝗗𝗲𝗯𝘂𝗴𝗴𝗶𝗻𝗴
Developers should not have the burden to only be proactive but rely on automated alerting. An automated alerting system may sound fundamental, but it's easy to miss relevant signals - especially when working with Lambda
{ 24/28 }
Developers should not have the burden to only be proactive but rely on automated alerting. An automated alerting system may sound fundamental, but it's easy to miss relevant signals - especially when working with Lambda
{ 24/28 }
The alerting mechanism should not only detect app errors, but also infrastructure faults like timeouts, container crashes, memory exhaustion, and misconfigurations like incorrect access policies.
With the immense amount of logs, that's not a trivial task.
{ 25/28 }
With the immense amount of logs, that's not a trivial task.
{ 25/28 }
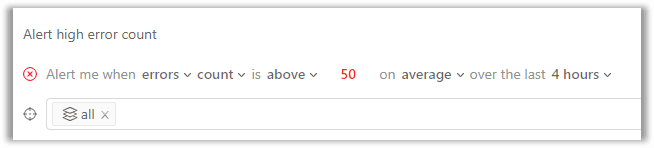
For parts of the system that are more tolerant to faults, developers may disable individual issue alerting and set up aggregation metrics. This allows the attention to shift from development to debugging only when it’s really required.
{ 26/28 }
{ 26/28 }
𝗙𝗮𝘀𝘁 𝗖𝗼𝗺𝗺𝘂𝗻𝗶𝗰𝗮𝘁𝗶𝗼𝗻
Lots of errors need to be fixed immediately, as they are significantly impacting the user experience. That's why developers need to be notified in a fast & convenient way
Most teams use a dedicated Slack channel for critical errors
{ 27/28 }
Lots of errors need to be fixed immediately, as they are significantly impacting the user experience. That's why developers need to be notified in a fast & convenient way
Most teams use a dedicated Slack channel for critical errors
{ 27/28 }
𝗪𝗿𝗮𝗽 𝘂𝗽
As we've seen: there are a lot of reasons for having great monitoring. But furthermore, the most important fact is that it makes the developer's job easier and more enjoyable and also provides confidence in your app's reliability & frees up time!
{ 28/28 }
As we've seen: there are a lot of reasons for having great monitoring. But furthermore, the most important fact is that it makes the developer's job easier and more enjoyable and also provides confidence in your app's reliability & frees up time!
{ 28/28 }
The complete article & more serverless related posts can be found at Dashbirds blog! ✍️
You're building a serverless SaaS product or already running one? 👋
Register at @thedashbird to try it out for free or send me a message to book a free demo! 👩💻
dashbird.io/blog/ultimate-…
You're building a serverless SaaS product or already running one? 👋
Register at @thedashbird to try it out for free or send me a message to book a free demo! 👩💻
dashbird.io/blog/ultimate-…
• • •
Missing some Tweet in this thread? You can try to
force a refresh


