
🧵*Weekly Bank Nifty Analysis for 18th Nov Expiry* 🧵
To form a view, let's have a look at both:
1. Technicals
2. Data
Also, 3 strategies to deploy for:
1. Aggressive Traders (2.2%)
2. Moderate Risk Traders (1.55%)
3. Low-Risk Traders (0.84%)
To form a view, let's have a look at both:
1. Technicals
2. Data
Also, 3 strategies to deploy for:
1. Aggressive Traders (2.2%)
2. Moderate Risk Traders (1.55%)
3. Low-Risk Traders (0.84%)
1. Technicals
Let's start with technicals. We'll look at -
1. Daily charts.
2. Hourly / 60 min charts.
3. 15 min charts.
1. Daily - Looks like we are at a support in Bank Nifty but the attempt to go up was very weak. Expecting Bank Nifty to go up from here just as a pullback.
Let's start with technicals. We'll look at -
1. Daily charts.
2. Hourly / 60 min charts.
3. 15 min charts.
1. Daily - Looks like we are at a support in Bank Nifty but the attempt to go up was very weak. Expecting Bank Nifty to go up from here just as a pullback.

Structure:
If it goes sideways and then makes a HH and HL formation and tries to go up we will play bullish, I will update that in case it happens.
Pattern:
We have also formed an inside candle in daily charts. We can align our trades towards wherever the break happens.
If it goes sideways and then makes a HH and HL formation and tries to go up we will play bullish, I will update that in case it happens.
Pattern:
We have also formed an inside candle in daily charts. We can align our trades towards wherever the break happens.

If it happens on the downside can heavily sell calls.
If on the upside can sell strangles 1-2 strikes away from the support and resistance as I’m not expecting a ferocious upmove.
If on the upside can sell strangles 1-2 strikes away from the support and resistance as I’m not expecting a ferocious upmove.
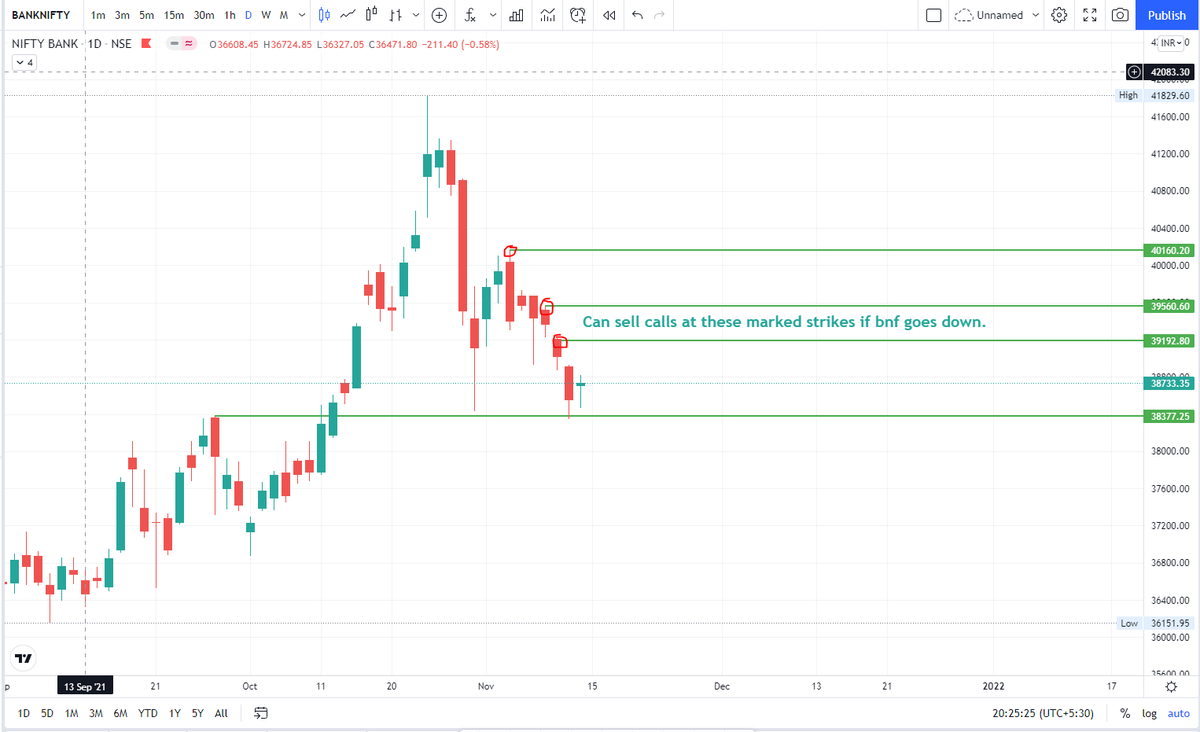
2. Hourly / 60 min charts.
Bank Nifty is in lower high and lower low structure.
I would like it to close above 40160 to play aggressively bullish.
For now, it looks sideways hence I have sold strangles.
If it makes a HH-HL before 40160, I will update.
Bank Nifty is in lower high and lower low structure.
I would like it to close above 40160 to play aggressively bullish.
For now, it looks sideways hence I have sold strangles.
If it makes a HH-HL before 40160, I will update.

3. 15 min charts.
We can see multiple resistances.
Every time Bank Nifty tries to move up it will face sellers hence not expecting a one-way-up move. If it goes slowly our calls will go to zero.
We can see multiple resistances.
Every time Bank Nifty tries to move up it will face sellers hence not expecting a one-way-up move. If it goes slowly our calls will go to zero.

Option chain data.
Both sides have sold nearer options. Which means a big move can come.
This would play really well on the downside as all those fresh put sellers would be trapped.
Easier trade would be to sell calls above highest OI strike if BNF goes down.
Both sides have sold nearer options. Which means a big move can come.
This would play really well on the downside as all those fresh put sellers would be trapped.
Easier trade would be to sell calls above highest OI strike if BNF goes down.

Strategies to deploy?
1. Aggressive Traders
Can sell strangles of 37700 and 40000 & try to manage.
Reaction points 39700 on upside and 38300 on downside.
ROI is around 2.28%.
1. Aggressive Traders
Can sell strangles of 37700 and 40000 & try to manage.
Reaction points 39700 on upside and 38300 on downside.
ROI is around 2.28%.

2. Moderate Risk Traders
Can sell strangles of 37500 and 40200 & try to manage.
ROI is approximately 1.55%.
Can sell strangles of 37500 and 40200 & try to manage.
ROI is approximately 1.55%.

3. Low-Risk Traders
Can sell strangles of 37200 and 40500. Fetches you approximately 0.84% ROI.
You guys should be targeting 2% per month and playing far away from spot levels of BNF.
4 expires per month to make 0.50%.
Can sell strangles of 37200 and 40500. Fetches you approximately 0.84% ROI.
You guys should be targeting 2% per month and playing far away from spot levels of BNF.
4 expires per month to make 0.50%.

If you ♥️ this analysis and derived some value from it, consider liking and sharing this tweet.
Retweet the first tweet and help others find this Thread.
Happy learning to everyone!
Retweet the first tweet and help others find this Thread.
Happy learning to everyone!
https://twitter.com/AdityaTodmal/status/1459901353061277698?s=20
• • •
Missing some Tweet in this thread? You can try to
force a refresh


