Matrices can be visualized as functions! This enables us to see matrix multiplication as function composition. In this thread let us take a visual tour of these mathematical ideas. To get this thread as a PDF: patternatlas.com/v0/matrices-as… 
I stumbled on this idea as a part of my logical explorations. I saw how the matrix way of representing things has an intertwining between simultaneity and sequentiality which is awesome! Let us start uncovering the ideas here by representing matrices as pixel grids.

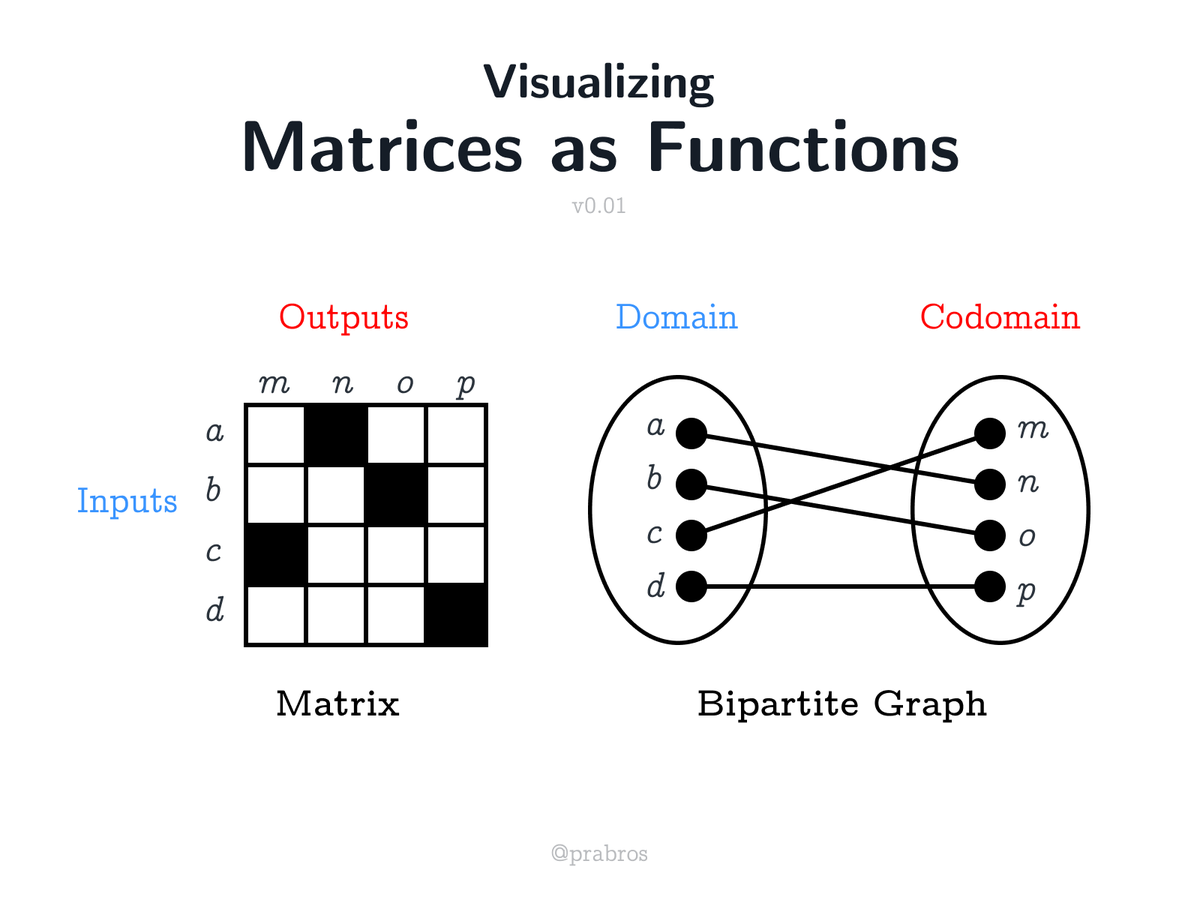
Let us label the matrix and understand how to represent arbitrary connections. A dark square in the pixel grid means a connection exists between a row element and a column element. A row element can be thought as an input and the corresponding column elements its outputs.

Matrices in general represent a relation, but for this thread, we will study boolean matrices which represent functions. This puts a restriction of having only one output per input.
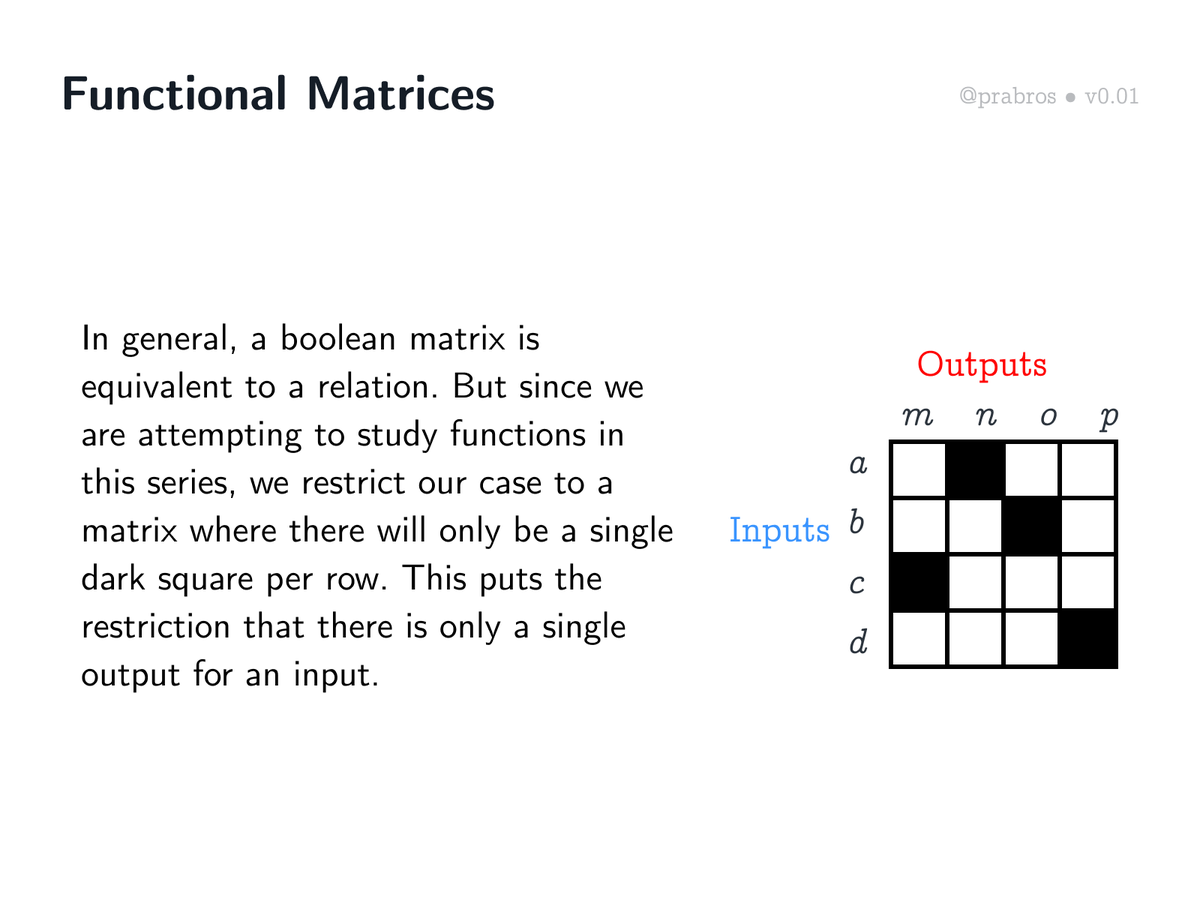
Let us walk through each of the rows and look at their corresponding outputs (dark squares) to understand how this matrix represents the functional mapping: {a ↦ n, b ↦ o, c ↦ m, d ↦ p}

Now let us shift gears and employ the representation of a bipartite graph which will allow us to have a different perspective on the mapping done in the matrix.

Here is a walkthrough of how mappings of the bipartite graph representation corresponds to that of the matrix.

This allows us to see that the same function mapping can be represented isomorphically both as a matrix and a bipartite graph. What comes up next is the interesting part!

This isomorphism opens up the space for interpreting matrix multiplication as function composition!

Matrix multiplication takes inputs of the source matrix to the outputs of the target matrix. This mirrors what happens in a function composition where you take the domain of the source function to the codomain/range of the target function.

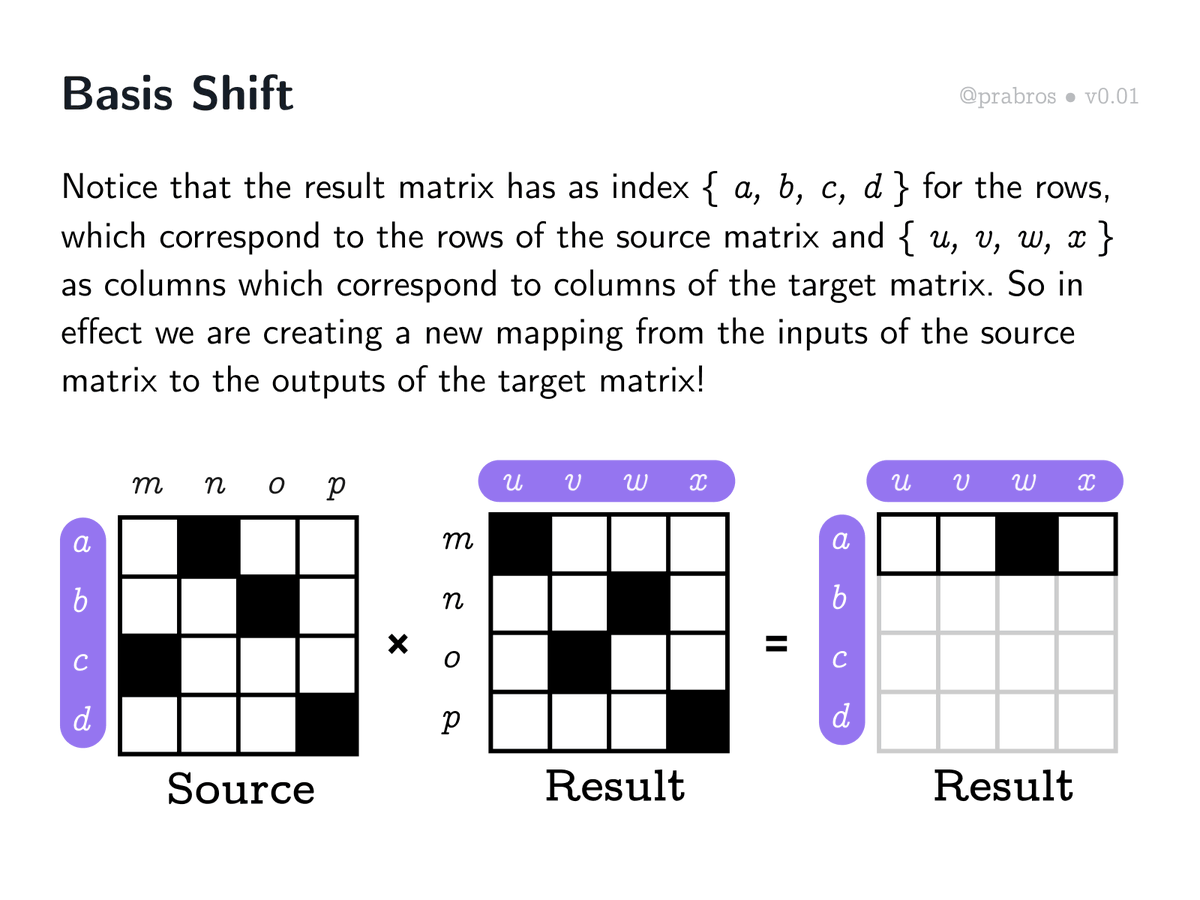
Multiplying matrices results in computing what the inputs of the source matrix map to in terms of the target. This is in effect a “basis shift”. We will examine what this means shortly.

Let us now walk through the mechanics of matrix multiplication. First we will understand the computational process and then arrive at an insight to do this by a simple look up operation.

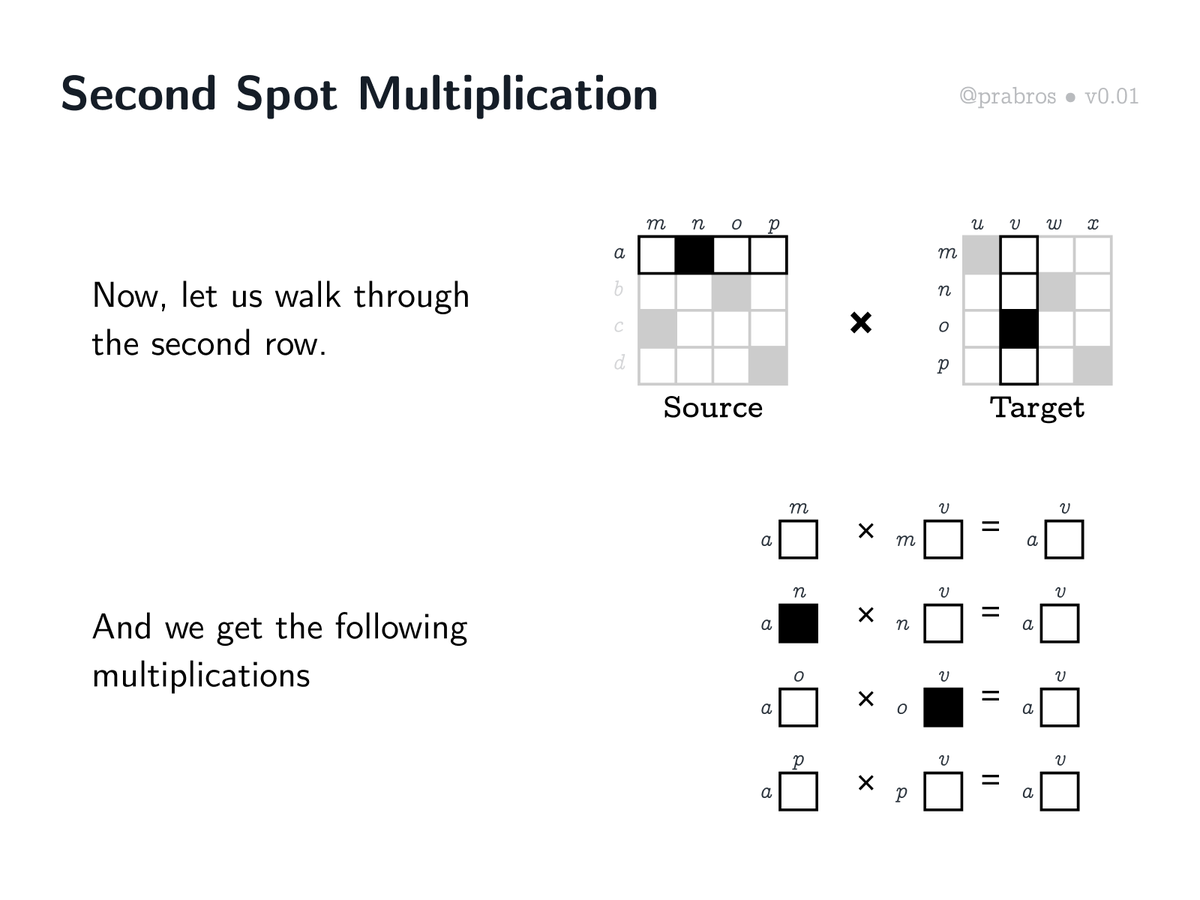
To multiply two matrices we first multiply a row of the source matrix with each column of the target matrix and then proceed on to do the same with the next row of the source matrix. We do so until all rows of the source are pairwise combined with the columns of the target.

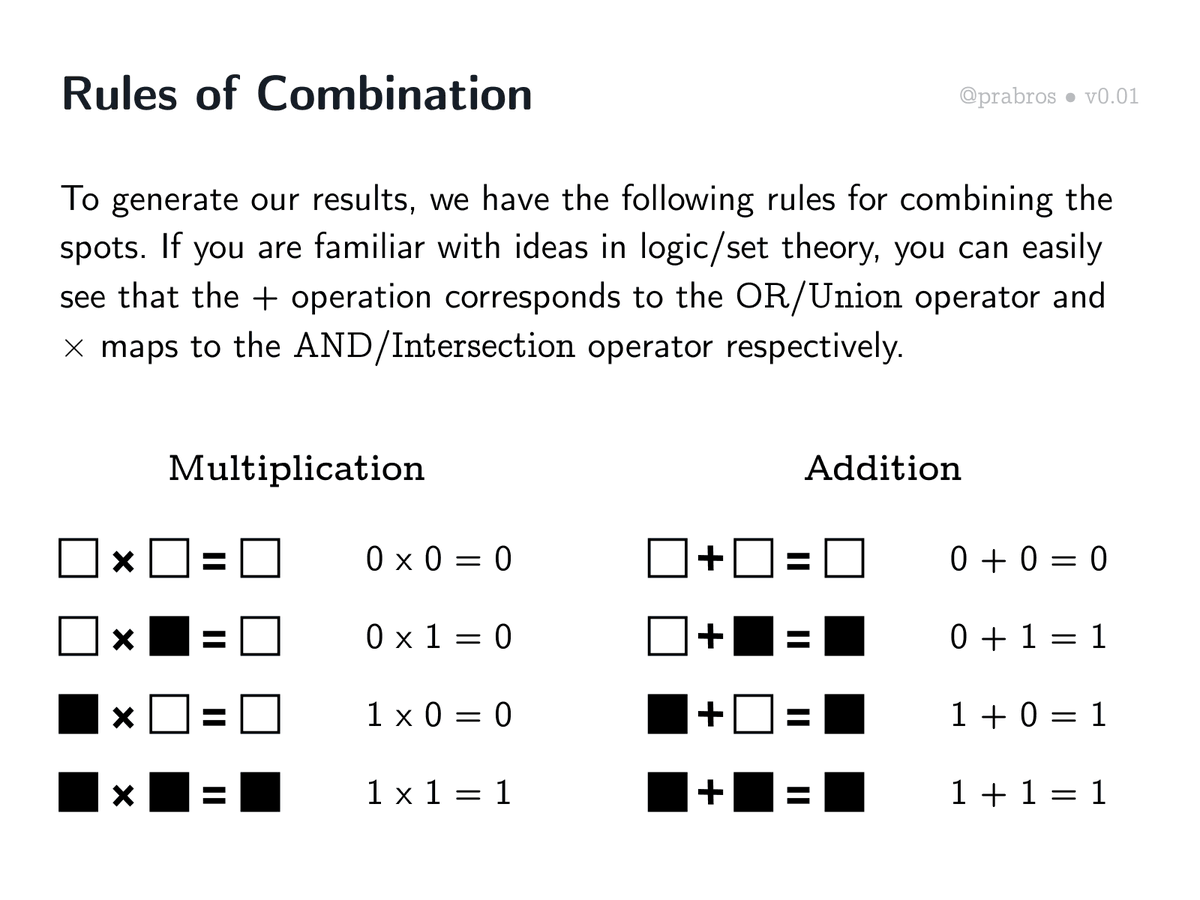
Let us acquaint ourselves with the rules that are used when combining rows and columns of a matrix. Being a logical matrix, it turns out that there are connections with logical operators/gates on computing the multiplication between rows and columns.

Matrix multiplication of a row and column generates an array of computations which are then collapsed down into a single value.

Here are the rules of combination we use for combining the spots of a logical matrix. A curious observation is that multiplication of spots corresponds to AND operator in logic / intersection (∩) in set theory and addition to OR operator in logic / union (∪) in set theory.
Let us use the above rules to conduct our first row-column multiplication:

The resultant multiplications are then added together to generate the first spot in the first row of the result matrix.

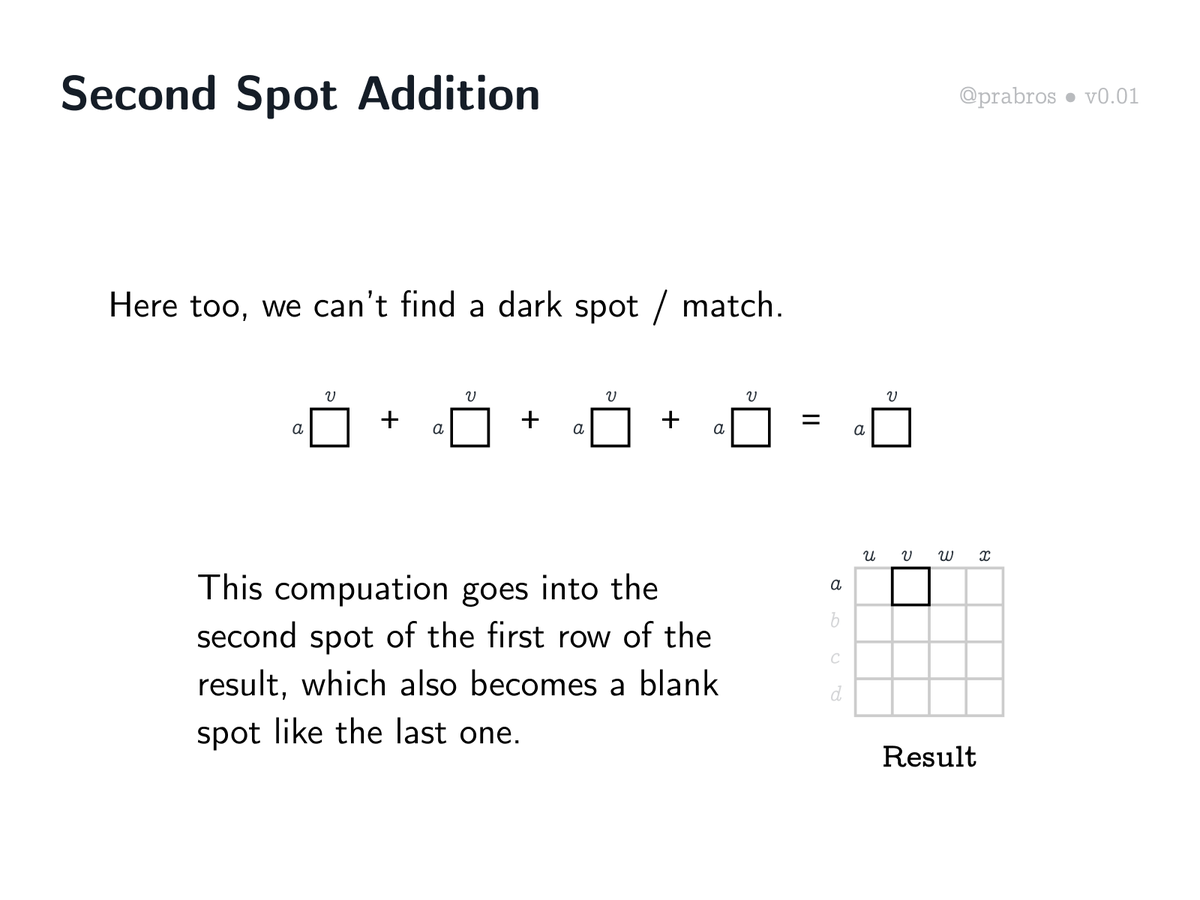
Let us move on to the first row - second column multiplication. The result of this multiplication will become the second spot in the resulting matrix.
As can be seen above, there’s no match in the multiplications this time. This would mean that the second spot in the first row of the resultant matrix would be empty.
Let us see what the story is third time around. It turns out that there’s a match this time! The second index of the first row of the source matrix and the second index of the third row of the target matrix happens to give us a match! Keep this matching on index idea in mind.
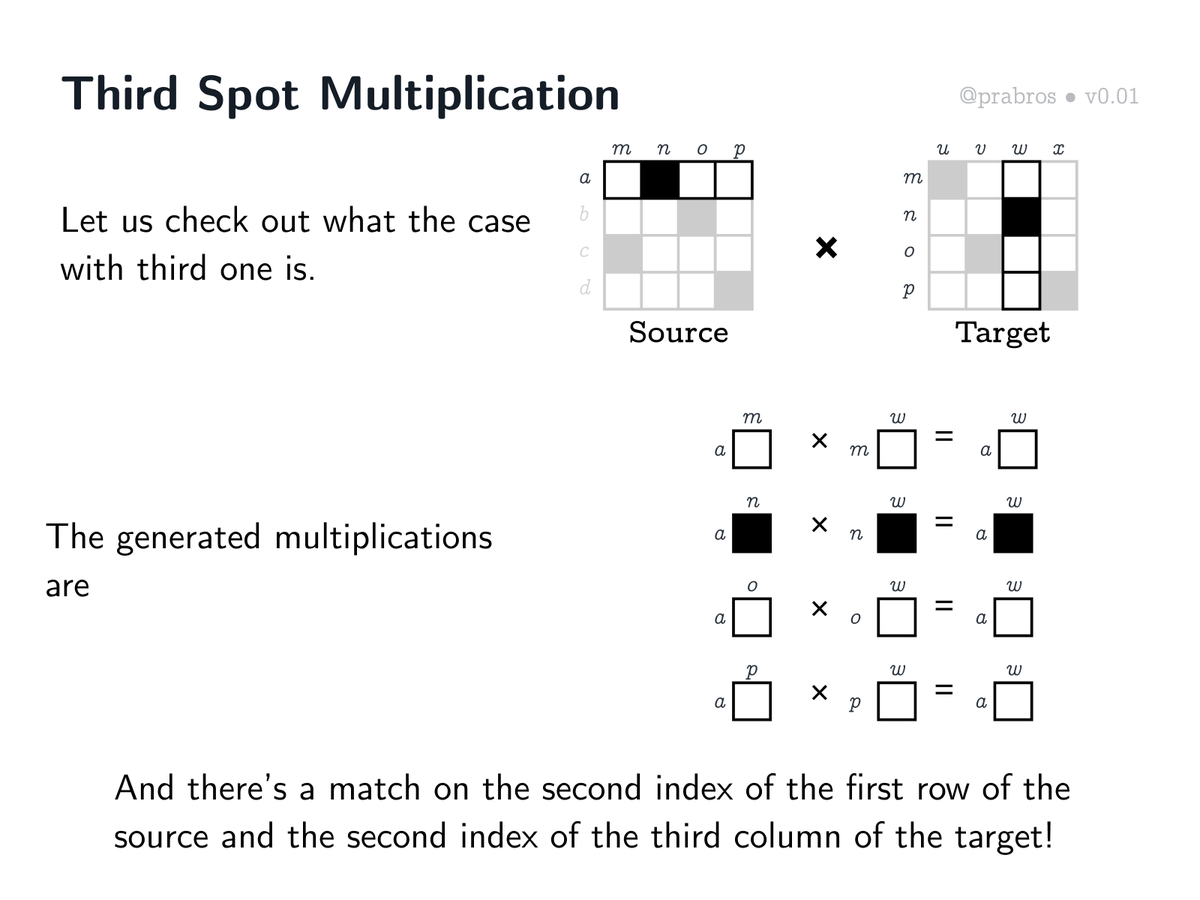
And the additions of these computations will give us a dark spot which means a connection between a and w (the third spot in the first row) has been established in the resultant matrix.

For completing the first row multiplication, let’s walk through the computation for generating the result of the fourth spot.

Like the first two spots, this will also result in an empty spot as no match was found.

The result of multiplications of first row of the source matrix against all columns of the target matrix fully determines first row of the result matrix. A thing to note — it maintains the necessary property for being a function: a single output for an input (a ↦ w).

What is happening here can be thought of as a “basis shift”. By multiplying matrices / composing functions together, we are trying to see what the first row in the source matrix is, from the “perspective” of the target matrix.
Having seen how computational steps in matrix multiplication using the traditional method works let us now move into seeing how this plays out with the bipartite graph representation. Turns out things are much simpler and intuitive! How? Lets find out.

Multiplying a row with columns in the matrix form is equivalent in the bipartite graph representation to seeing where the output of the source graph (a ↦ n) matches up with the input of the target graph (n ↦ w). This unlocks a straightforward way to do function composition.

When composing graphs, we see a sort of “exclusion of the middle” happening. The codomain of the source graph and domain of the target graph act as the common middle that gets elided when we perform the composition.
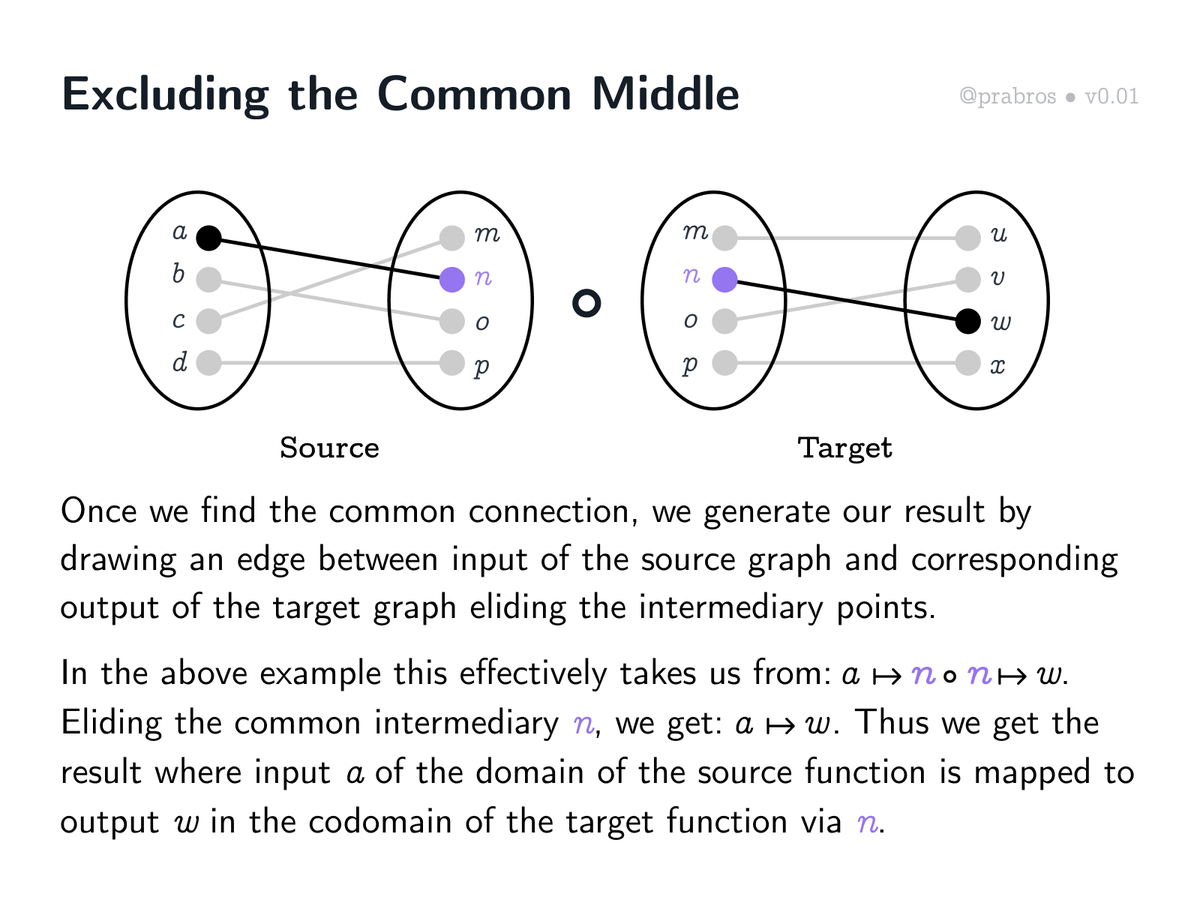
Computing function composition using graphs is now pretty straightforward: check what the source graph outputs map to in the target graph. The resulting connection between source’s inputs and target’s outputs is the result!
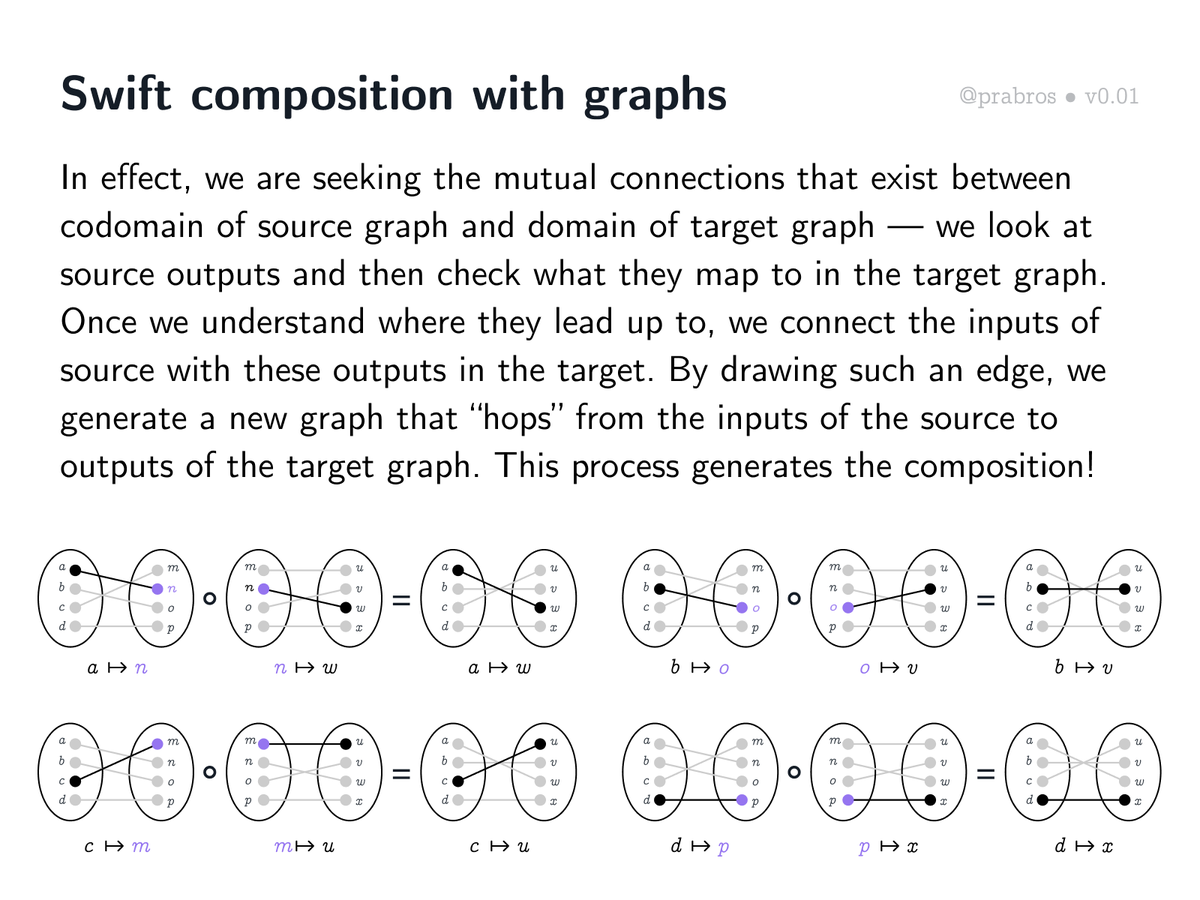
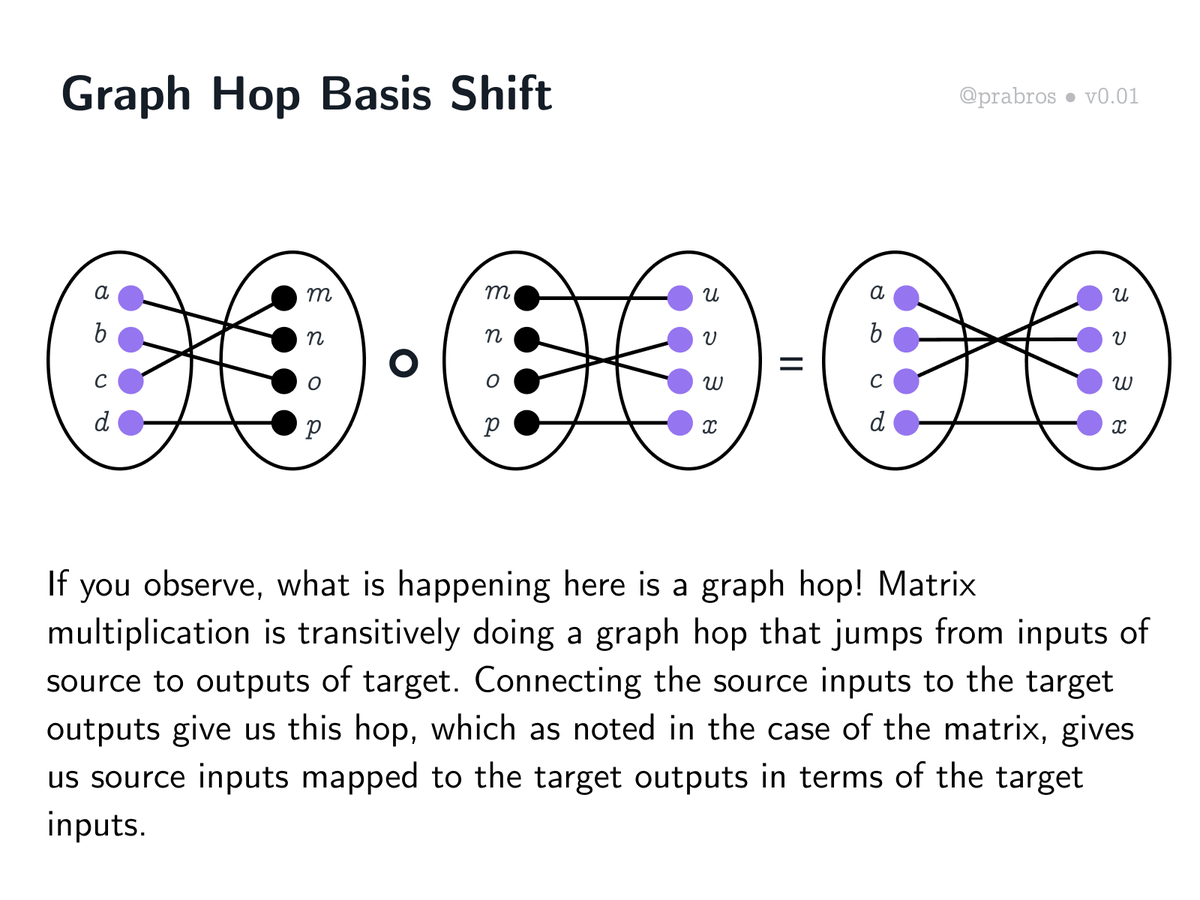
We can see this as creating a connection between the source’s inputs { a, b, c, d } and target’s outputs { u, v, w, x } through the intermediary { m, n, o, p } that acts both as source’s output and target’s input.

If you observe, what is happening here, is a graph hop! And this is the basis shift idea mentioned in the case of matrix multiplication. We get a new graph which has inputs of the source mapped to outputs of the target in terms of the inputs of the target!
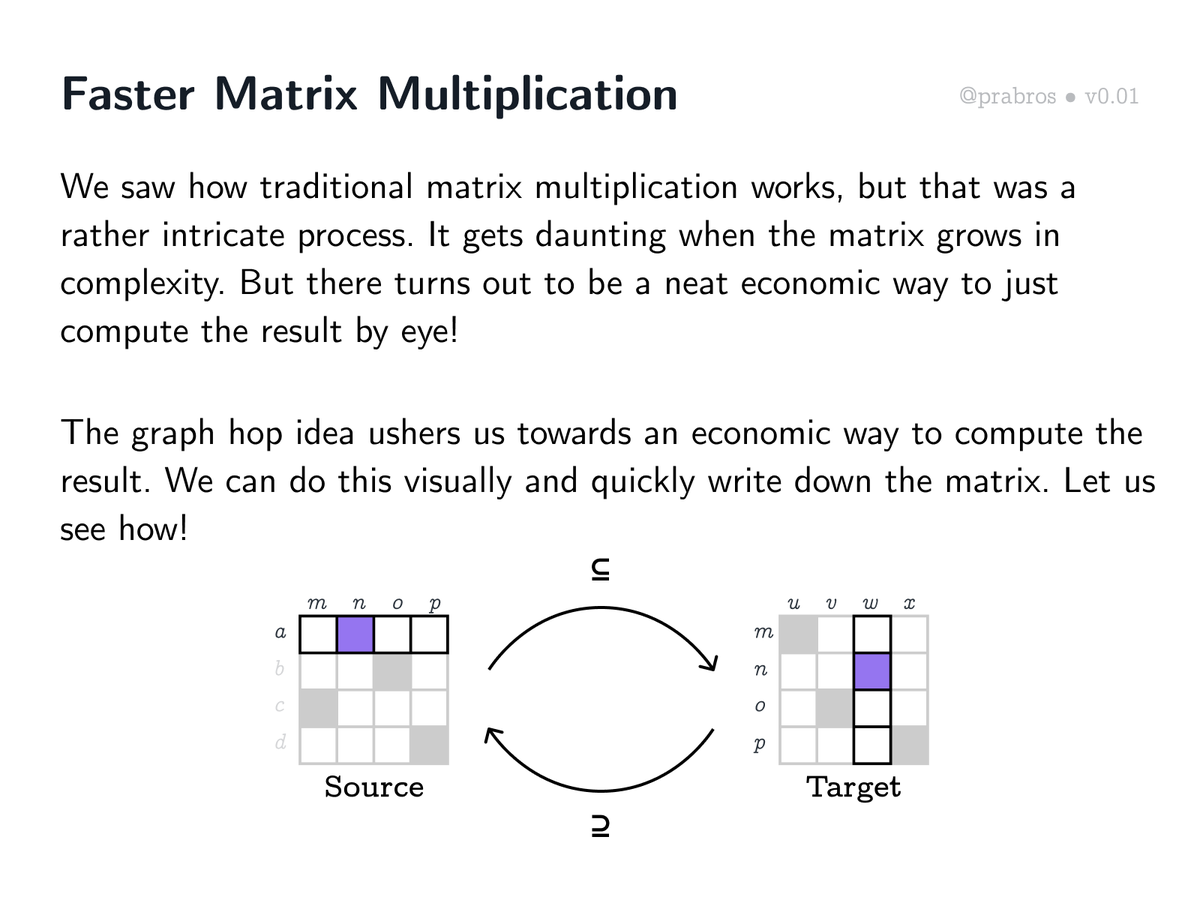
We saw how matrix multiplication is done in the traditional style. Turns out there is a way to do this quickly in the case of functional matrices by using symmetry. The previous graph hop idea ushers us towards a faster matrix multiplication style. Let us see how up next.
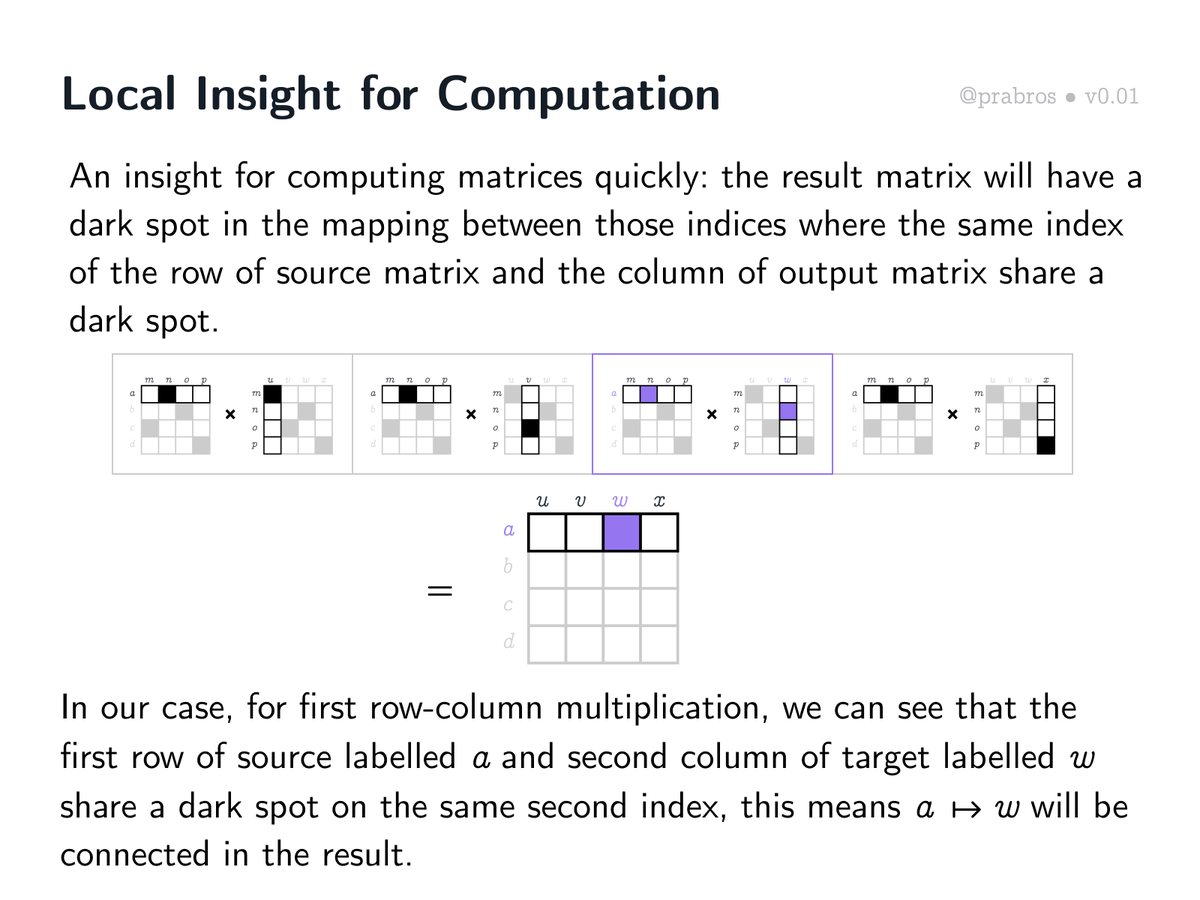
Here is a “local” insight: In a functional logical matrix multiplication, we get a match when the index of the row in the source matrix and the index of the column in the target matrix match up. In this case, we get a match on source row “a” and target column “w” giving a ↦ w.
Now, here’s a global insight for matrix multiplication: Whenever the source row we are multiplying with can be rotated to be congruent with the target column, we get a match! We need to extend this to an inclusion in case we have multiple mappings in the column.

Using the global insight, we can compute by reasoning with symmetry. Whenever there is a rotated copy of the row present as a column, we just mark that block as a mapping in the result. Once we do this for all the individual multiplications, we get our result!
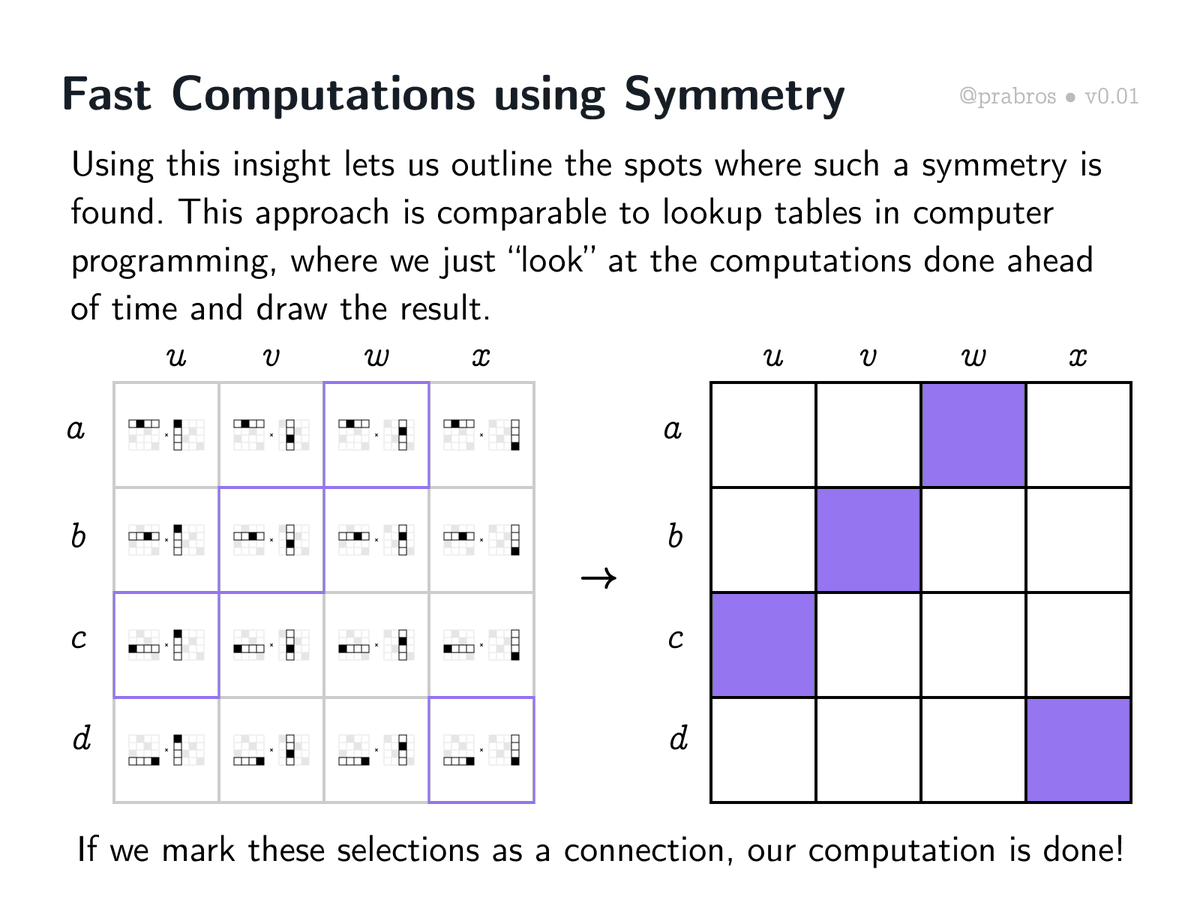
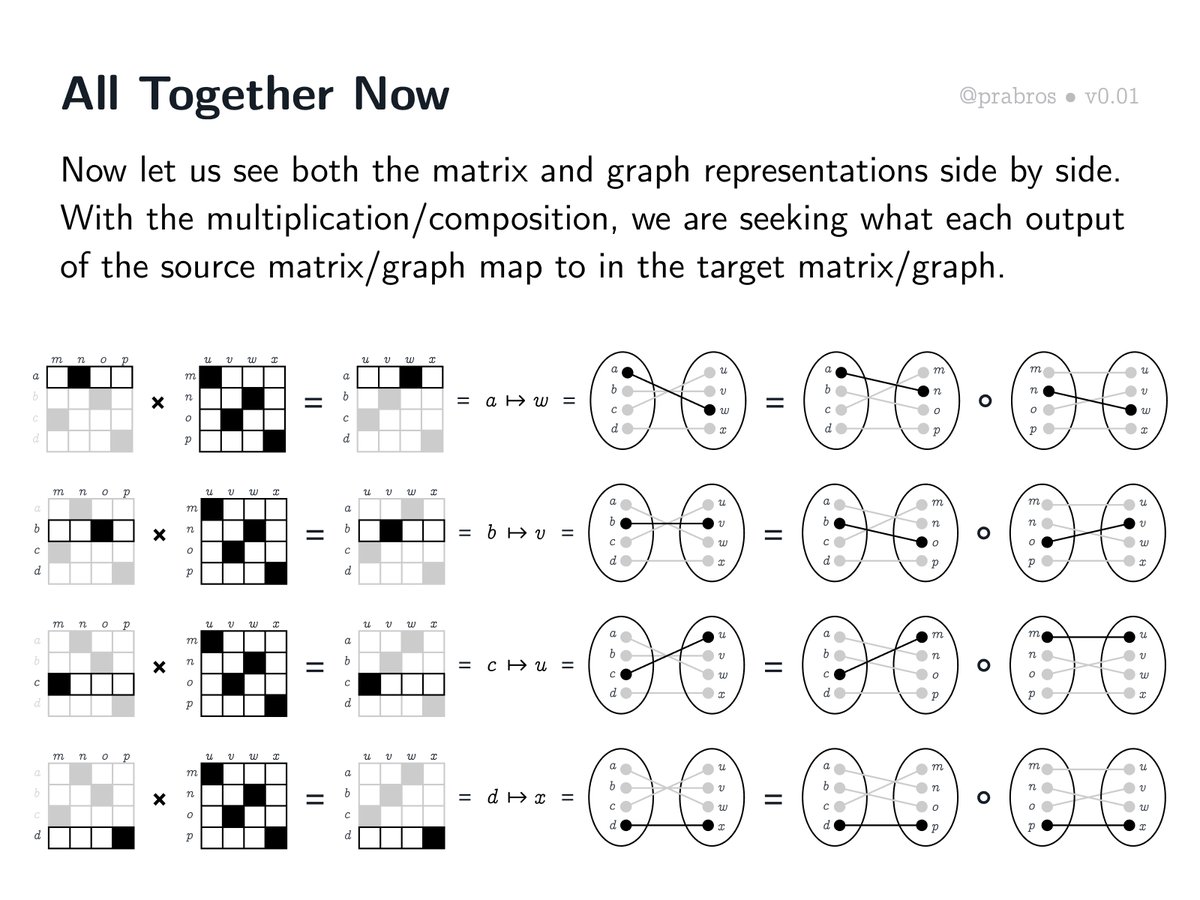
Let us employ insights gained so far and do the matrix multiplication row by row visualizing them both as a matrix and a bipartite graph. Here is how the whole matrix multiplication unfolds.
• • •
Missing some Tweet in this thread? You can try to
force a refresh