Polling the Nolan principles. On behalf of
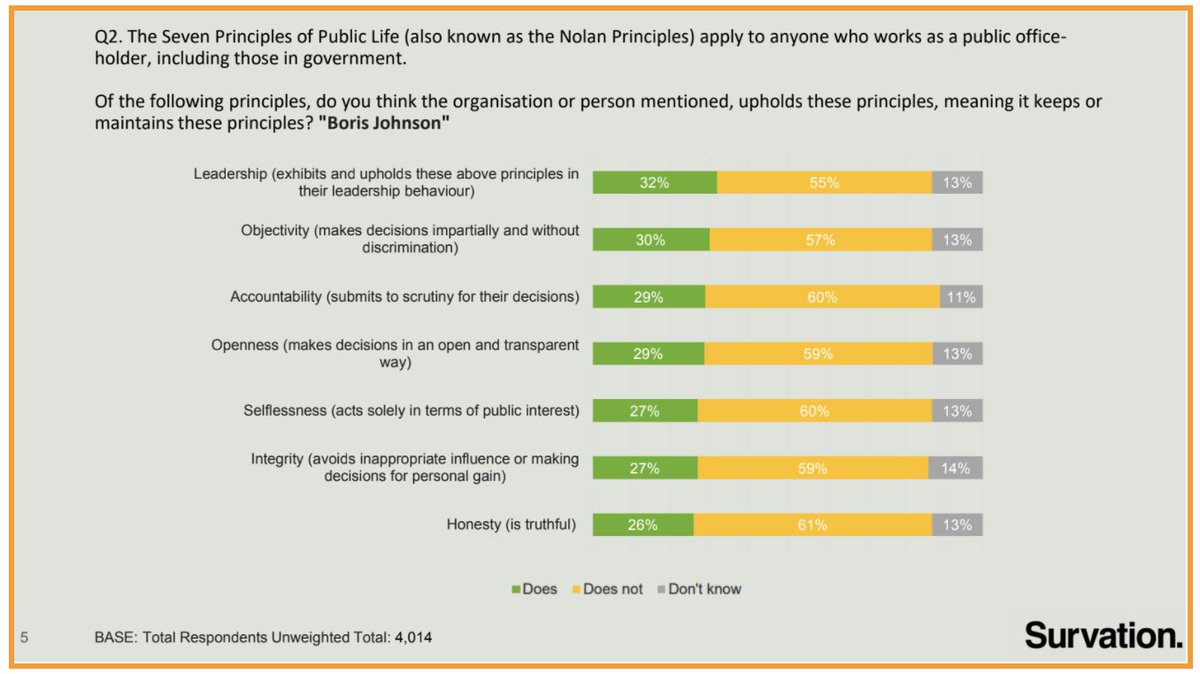
@38_degrees we asked over 4000 members of the public to rate the Government, MPs, Boris Johnson and the Labour Party on Nolan's 7 ethical standards in public life, here's what we found:
Almost 6 in 10 (59%) people do not believe the Government upholds the Nolan principle of integrity, and 62% do not believe it upholds the principle of honesty.
55% of the public believe Boris Johnson as Prime Minister does not exhibit leadership. Only 1 in 3, (32%) says he does.
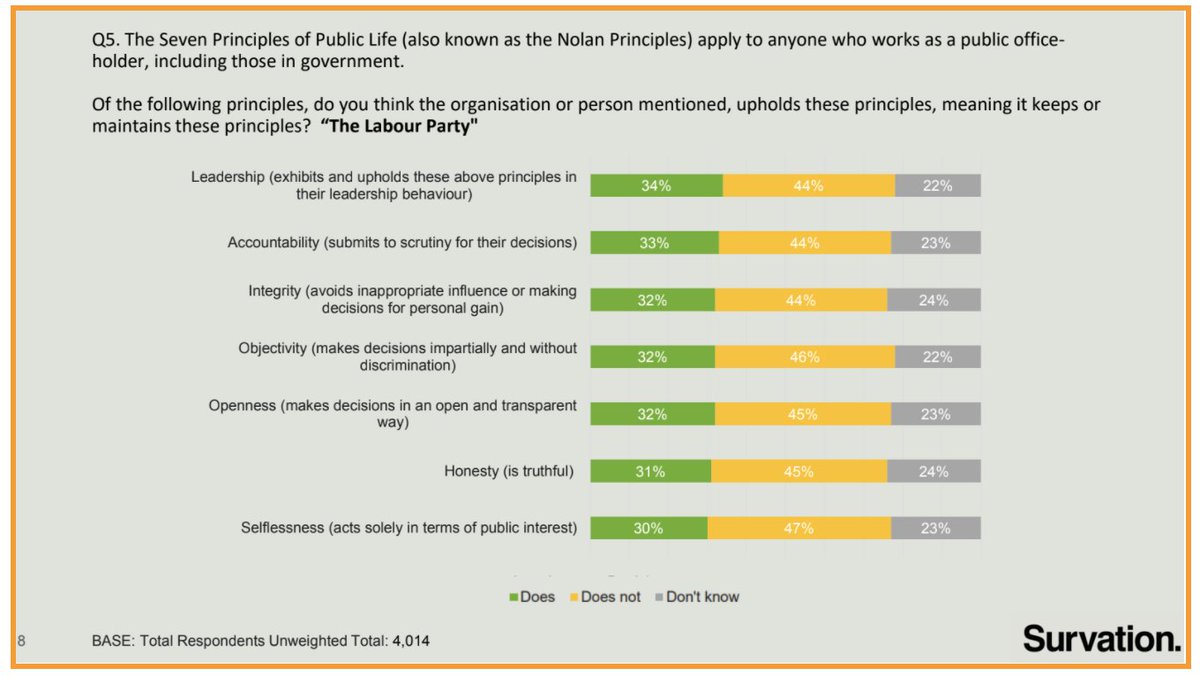
The Labour Party do not score well, however..
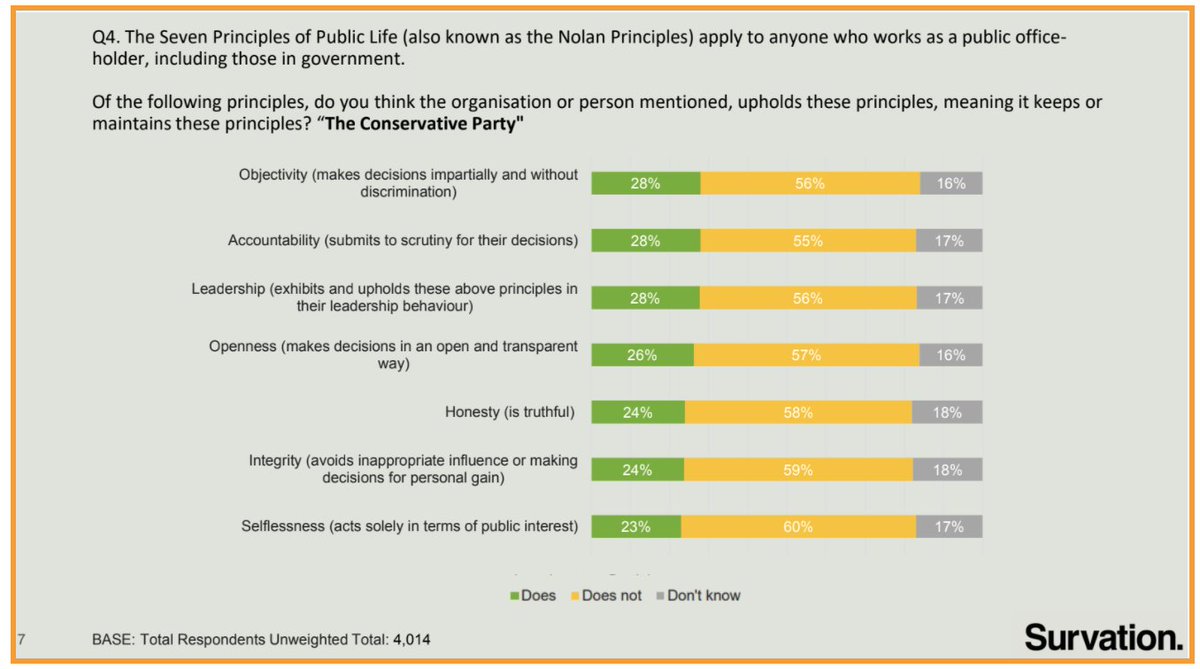
The Conservative Party is perceived worse on these measures:
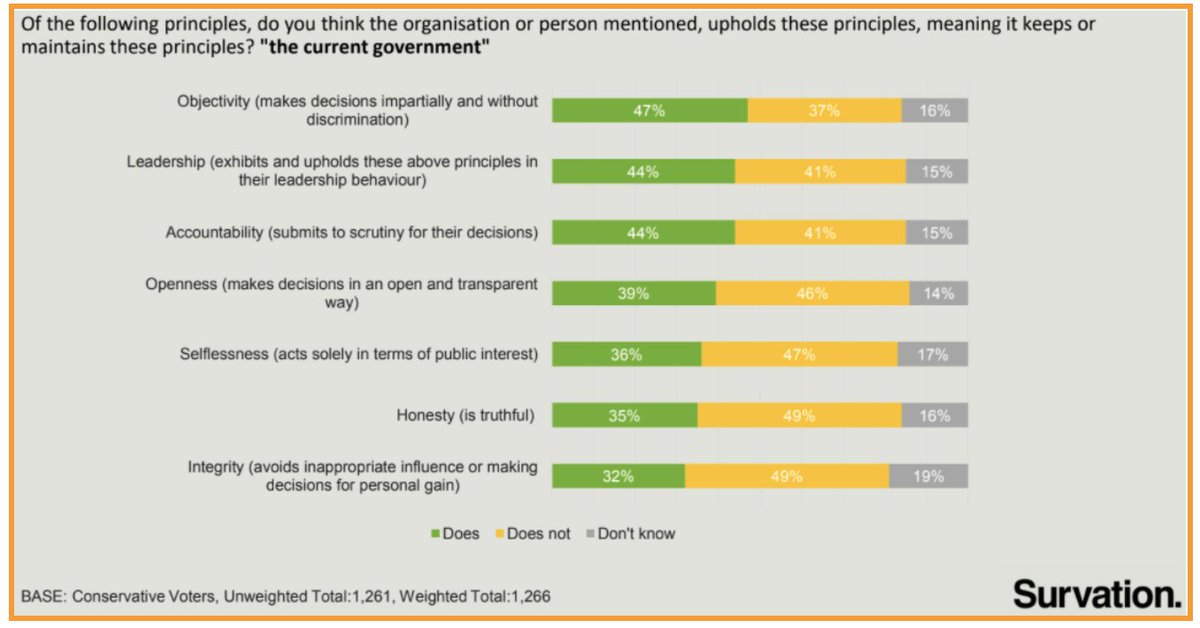
More 2019 Conservative voters said that they believed the current Government does *not* act with openness, selflessness, honesty and integrity than those who said it did:
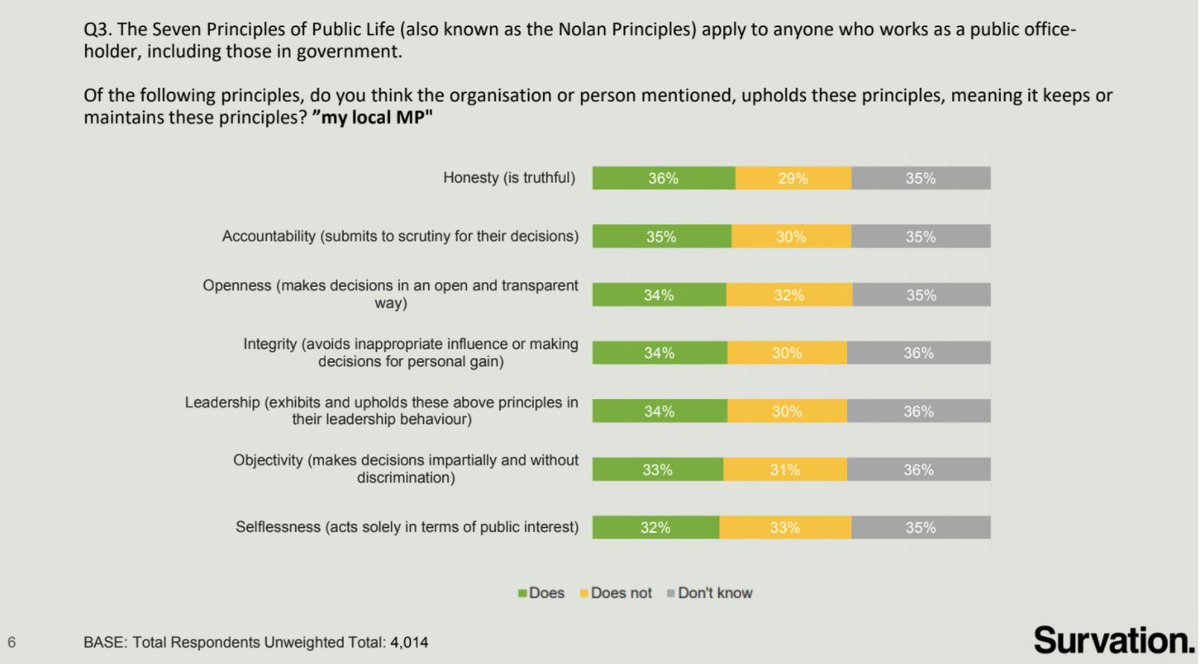
Polling showed that while the British public are disaffected with MPs in general:
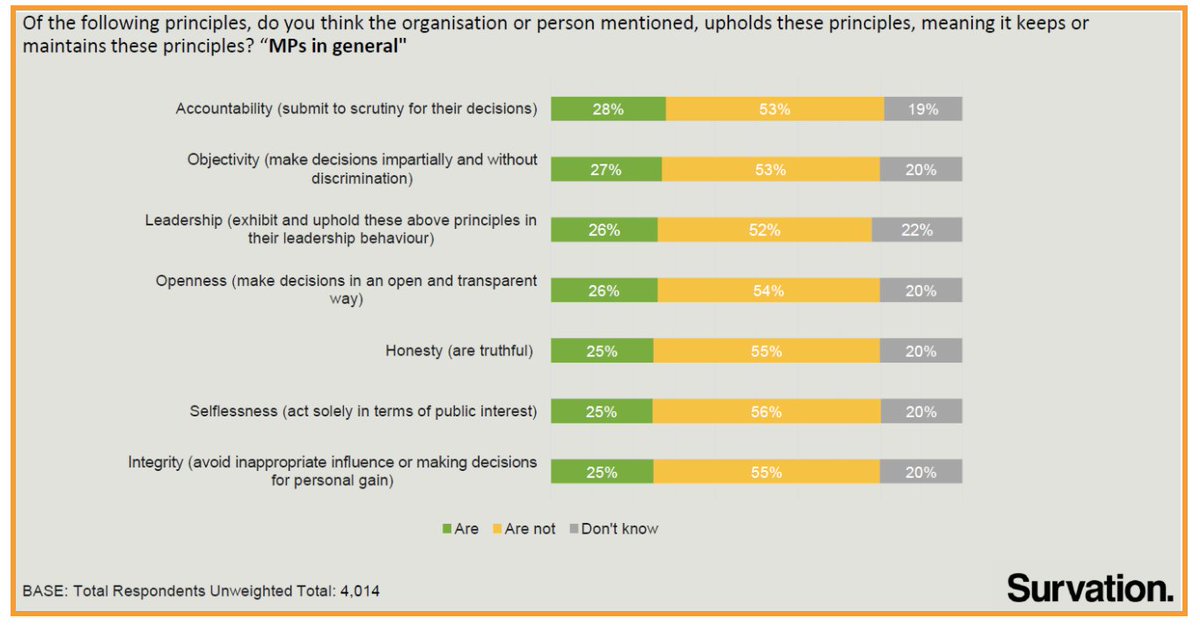
The public believe their own MP is more likely to uphold the Nolan principles of public life:
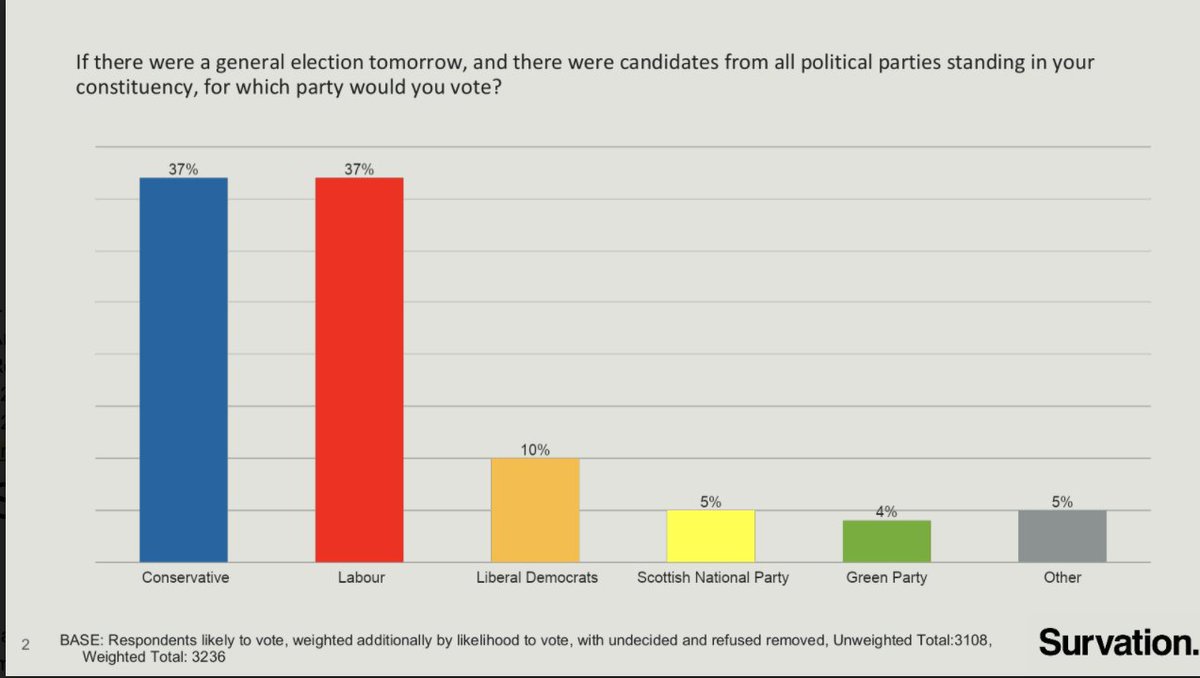
The latest Survation national results of 3236 voting intentions, conducted with this poll, puts Labour and the Conservatives on level pegging - 37%, a change on the last round of Survation results published in October, where the Conservatives enjoyed a 4 point lead (39% to 35%).
Fieldwork between 11th-15th November 2021, 4,014 residents online 18+ in the UK.
Data tables & methodology are here: cdn.survation.com/wp-content/upl…
Full party breakdown was: CON 37% LAB 37% LD 10% SNP 5% GRE 4% REFUK 2% Others 5%

Further notes here: mailchi.mp/survation/poll…

• • •

Missing some Tweet in this thread? You can try to force a refresh
 

Keep Current with Survation.

Survation. Profile picture

Stay in touch and get notified when new unrolls are available from this author!

Read all threads

This Thread may be Removed Anytime!

PDF

Twitter may remove this content at anytime! Save it as PDF for later use!

Try unrolling a thread yourself!

how to unroll video
  1. Follow @ThreadReaderApp to mention us!

  2. From a Twitter thread mention us with a keyword "unroll"
@threadreaderapp unroll

Practice here first or read more on our help page!

More from @Survation

16 Nov
Survation gave evidence to an APPG meeting in September on research we conducted in “Left Behind” neighbourhoods for Local Trust. @appgleftbehind
Residents in these areas are more at-risk for feeling the impacts of climate change with around a quarter of these areas being coastal communities, yet our research showed most residents are concerned and think that their councils are not doing enough.
We found projects to improve housing, air quality, access to green spaces and jobs are overwhelmingly popular with residents and will have co-benefits to climate action. Local Trust released a report yesterday outlining our research findings and the content of the APPG meeting.
Read 4 tweets
20 Jul
NEW – Westminster Voting Intention:

CON 39% (-4)
LAB 35% (+3)
LD 11% (+2)
GRN 5% (-1)
SNP 4% (-)
OTH 6% (-)

survation.com/conservative-l…

1,032 respondents, fieldwork 19-20 July '21. Changes w/ 5-13 July '21.
NEW – Leadership Favourability Ratings:

Boris Johnson / Keir Starmer

Net: -13% (-10) / -14% (-2)

Favourable 35% (-5) / 27% (-)
Unfavourable 47% (+5) / 41% (+2)

1,032 respondents, fieldwork 19-20 July '21. Changes w/ 5-13 July '21.
NEW – Party Favourability Ratings:

Conservative / Labour

Net Rating: -9% (-7) / -10% (-1)

Favourable 35% (-3) / 31% (-1)
Unfavourable 45% (+4) / 42% (-)

1,032 respondents, fieldwork 19-20 July '21. Changes w/ 5-13 July '21.
Read 8 tweets
22 Apr
NEW @Survation Poll – Westminster Voting Intention:

CON 40% (-3)
LAB 34% (-1)
LD 9% (+1)
GRN 7% (+3)
SNP 4% (+1)
RUK <1% (-)
OTH 7% (+2)

survation.com/survation-poli…

1,008 respondents, fieldwork 15-19 April 2021. Changes w/ 8-10 April.
NEW – Leadership Favourability Ratings:

Johnson / Starmer

Net Rating: 0% (-1) / -3% (+1)

Favourable 42% (-) / 34% (+1)
Neutral 14% (-1) / 25% (-1)
Unfavourable 43% (+2) / 36% (-1)

1,008 respondents, fieldwork 15-19 April 2021. Changes w/ 8-10 April.
NEW – Government Performance Favourability Ratings:

Net Rating: -6% (-9)

Favourable38% (-5)
Neutral16% (-)
Unfavourable44% (+4)

1,008 respondents, fieldwork 15-19 April 2021. Changes w/ 8-10 April.
Read 4 tweets
31 Oct 19
As working out the effect of potential tactical voting is causing some interest today, here's another example to understand the phenomenon.
In 2017, Survation polled the constituency of Bath, on behalf of the local Labour party.
Asked simply: If the General Election was tomorrow, which party would you vote for in your Bath constituency? Headline results were:

CON 32%
LAB 17%
LD 46%
AP 5%
However when we asked:
Now please imagine that at the next General Election the Conservatives, Labour and the Liberal Democrats all have an equal chance of winning in your Bath constituency. Which party would you vote for in that situation? We found:

CON 30%
LAB 36%
LD 30%
AP 4%
Read 6 tweets

Did Thread Reader help you today?

Support us! We are indie developers!


This site is made by just two indie developers on a laptop doing marketing, support and development! Read more about the story.

Become a Premium Member ($3/month or $30/year) and get exclusive features!

Become Premium

Too expensive? Make a small donation by buying us coffee ($5) or help with server cost ($10)

Donate via Paypal

Thank you for your support!

Follow Us on Twitter!

:(