
1/50 Bitcoin 550k – 820k cycle top prediction
In this thread I share my analysis and a realistic scenario how Bitcoin could possibly go to 550k-820k this cycle between Sep 2022 - Apr 2023 because of its characteristic 4 wave pattern, top lines and lengthening cycles playing out
In this thread I share my analysis and a realistic scenario how Bitcoin could possibly go to 550k-820k this cycle between Sep 2022 - Apr 2023 because of its characteristic 4 wave pattern, top lines and lengthening cycles playing out
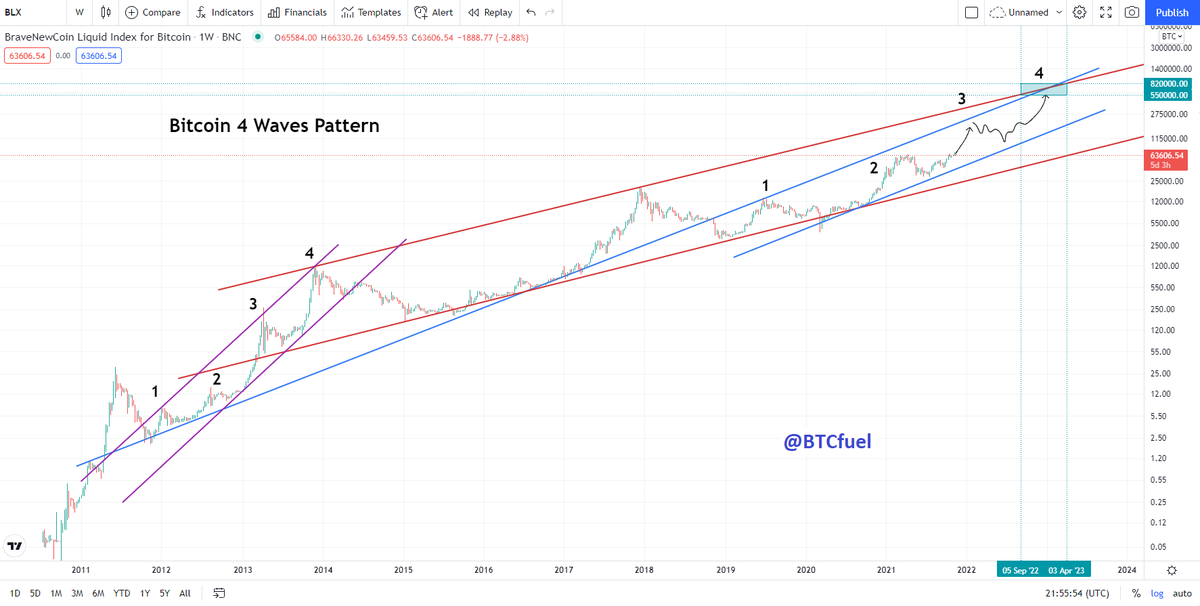
2/50 The previous picture was Bitcoins 4 wave pattern. Underneath you see bitcoin price prediction with the top lines and Fibonacci extension. All will be explained in this thread

3/50 - 4 wave pattern

4/50 Months ago I came across this chart from @888Velvet. He identified 4 patterns which repeat every Bitcoin bull cycle (I added the count to 4). To me it’s the most important pattern in crypto, because it started before the 1st halving. The projected price seems unrealistic IMO

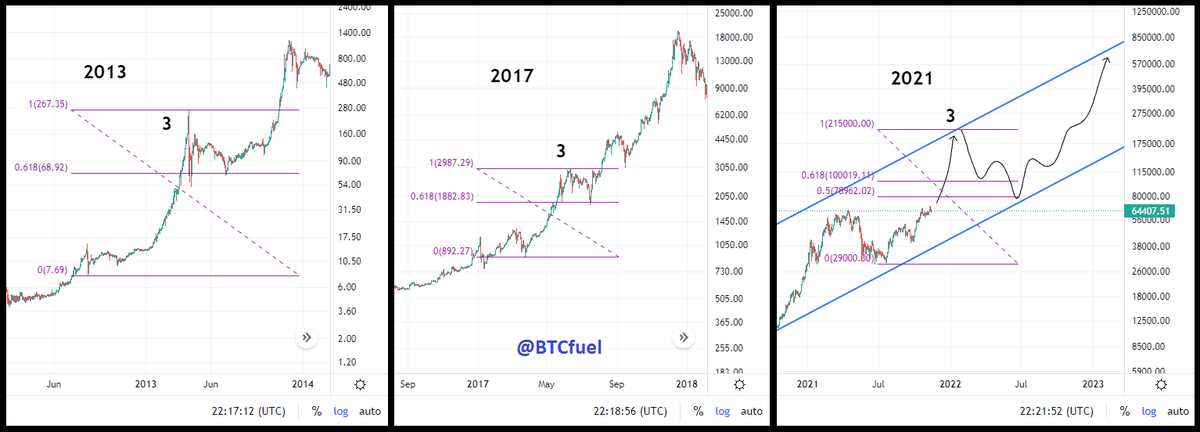
5/50 This is what I call Bitcoin’s 4 wave pattern. I’ve drawn this on another clean chart below. I believe history will repeat and we will see this 4 wave pattern play out this cycle. As you can already see. Bitcoin still has a lot to go. Wave 3 and 4 are yet to happen

6/50 2013 was the most stereotypical Bitcoin cycle. Its 4 waves are clearly visible. The surface area between Bitcoin’s price and its ‘baseline’ is a quick indication of the signal strength. People can get confused by the 2017 cycle which has a weak signal and deviations
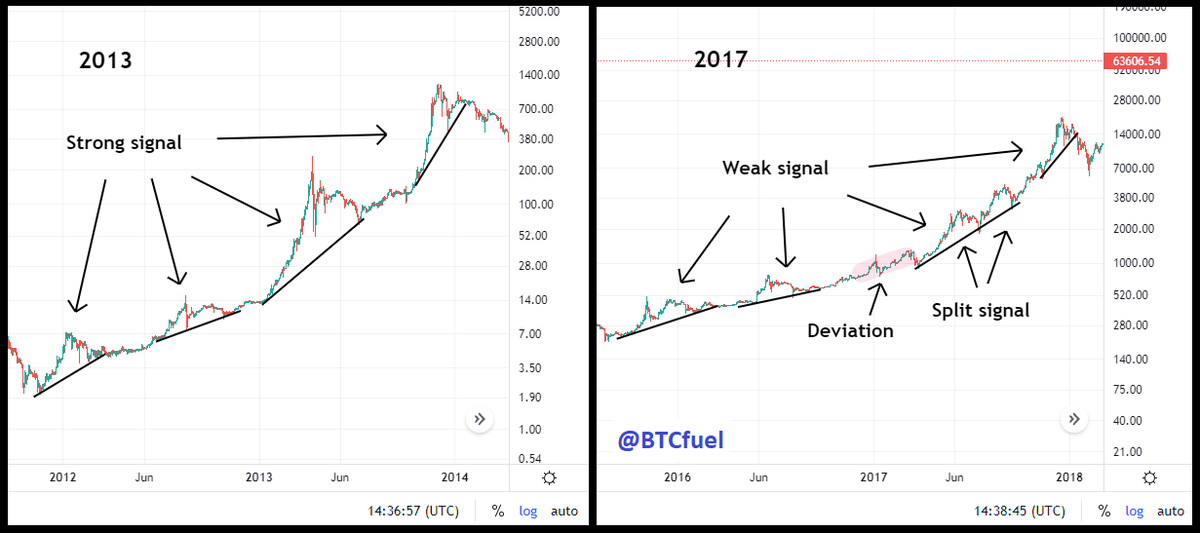
7/50 The Realized Cap HODL Waves is a graph often used to estimated the cycle top. With the knowledge from above, this chart becomes much clearer. Wave 3 of 2017 was split up because of the dip to the 1.618 fib extension (2013 top / 2015 low), this happens somewhere every cycle

8/50 The 2013 cycle should be used as an example for this cycle because of its clear signal. It seems that this cycle will look similar to it but with an even stronger signal and extended in time. Both seem to move in a nice channel. I’ll explain more about that later

9/50 Right now Bitcoin is only between wave 2 and 3. Both waves 3 and 4 have yet to happen. In the 2013 and 2017 cycle we had still to go about 1 year to the top from that moment in the cycle

10/50 Therefore a cycle top in at the end of 2022 / beginning of 2023 is a very real possibility

11/50 It looks like cycles are still lengthening and the theory still stands

12/50 For now one should keep an eye out for this type of pattern shaping up

13/50 - Top lines

14/50 Bitcoin right now is moving in channel. Breaking above this channel is not expected for now

15/50 This is the first top line for each cycle. To me it’s the most important top line in crypto. It forms the resistance we never break above in each new cycle

16/50 This line passes through the bear market capitulation. Some bit later the line gets retested. This means a major diagonal support line has become resistance

17/50 In my opinion there are 2 options for this cycle for this top line. I prefer the blue line. You can see on the chart where the main differences are. Obviously, this results in less accuracy for the prediction of this cycle top
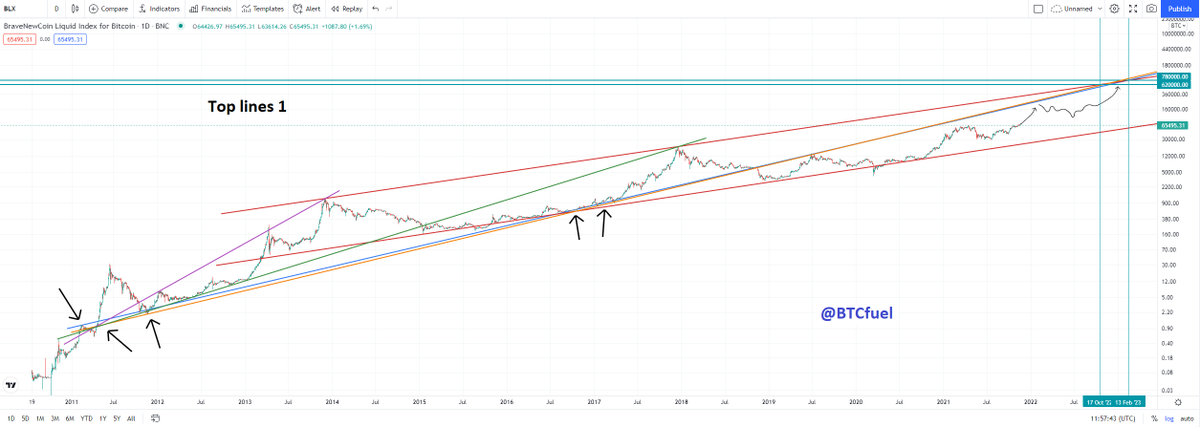
18/50 The second top line passes through a distinctive temporary support in the bear market and through the second peak of wave 3 of the previous cycle

19/50 The third top line is a line of a specific channel that I call “final bull market channel”. The top line touches “the wick”, wave 2 and the second top of wave 3. The wick and wave 2 are combined in 2013. This cycle we already touched the wick and wave 2

20/50 All of these lines coincide at the cycle top. These lines also coincide with the big red channel. This cycle the lines have to travel a long distance, so there is less accuracy. Therefore Sep 2022 – Apr 2023 between 550k and 820k is a nice target zone

21/50 This chart is a summary of what just has been explained

22/50 - Time extension

23/50 This chart you have already seen. From where we are now it probably is still 1+ year to the cycle top

24/50 In the past, when wave 3 reached its top, it was 6-8 months till the cycle peak

25/50 After wave 3 we retraced with a final dip in July. Afterwards we went up for the final wave 4. Will we dip again in July? In the past after the dip it was about 5 months to the cycle top

26/50 The combination of the top lines and past timings, Sep 2022 – Apr 2023 is a good target zone for the cycle top timing. I didn’t yet look into time Fibonacci extensions and top-to-top/ bottom-to-bottom/ … full cycle length behaviour. Maybe there’s even more clues there

27/50 - Price extension
28/50 Every cycle Bitcoin hits a log Fibonacci extension. The closest one to the target previously defined target zone is the 3 Fib extension with a 779.000 target

29/50 Entering wave 3 an interesting plausible target is 203.000 because two log Fib extension coincide at that level. I would still keep in mind it can go higher or lower (145k – 270k), but the main focus is 200k – 220k

30/50 Bitcoin has been building a base around 40k – 50k levels. The longer the base, the bigger explosion to the upside

31/50 When wave 3 hits its high, Bitcoin retraced to 0.618 log Fibonacci level in the past. This cycle I would look out for both 0.618 and 0.5. This is because of a lot of people thinking this cycle is over. In this graph I used 215k because Bitcoin will likely overshoot target
32/50 After the wave 3 impulse move. Bitcoin never fully retraced in the past. So we shouldn’t see 65k again

33/50 If Bitcoin retraces to 100k (0.618 log Fib), we could see these Fibonacci targets. Again two log Fibs would coincide near 770k. Two other targets in fall the 550k – 820k range

34/50 if Bitcoin retraces to 79k (0.5 log Fib), we could see again 2 log Fib targets coincide near 770k. On other target falls too in the 550k - 820k range

35/50 In this chart I’ve drawn all the top lines and redrawn the price trajectory, more closely to the expected shape. I expect wave 3 to go to the top of the purple “final bull market channel” and possibly wick above. 203k was the Fib target, 1 Feb is new moon (see later)

36/50 Next we could retrace to 100k, the 0.618 Fib retracement. This is also the “final bull market channel” bottom of channel line. It could easily play out in July, in the past Bitcoin always had a July dip before starting wave 4 as mentioned previously

37/50 At last we move to the top of the channel to 780k where all the top lines intersect. The 20th of February 2023 is a new moon day (see later)
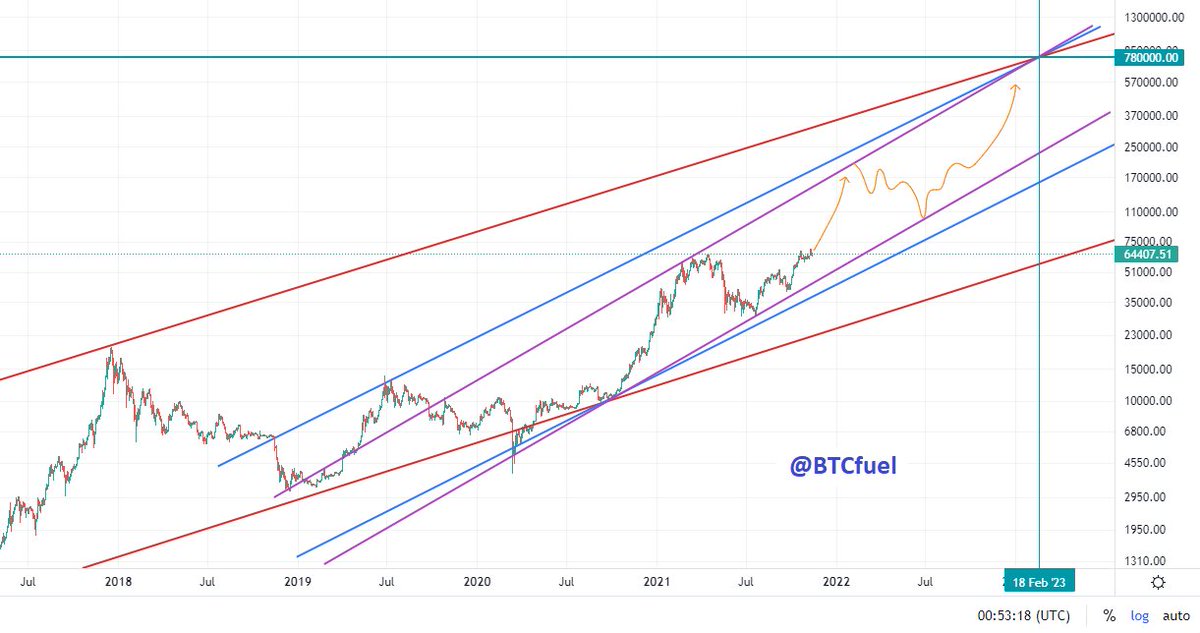
38/50 Bitcoin could also wick above or below the purple channel

39/50 The green channel is also a nice channel in which Bitcoin could be moving for a while and find support on while moving to the 780k top. (Especially the orange trajectory fits nicely inside the channel).

40/50 To conclude: Over here you see the most important resistance lines, channels and the target zone for the price and time

41/50 Some tweets ago I mentioned something about new moon. Humans are energetic beings. Full moon makes them anxious, new moon calm. This reflects in the Bitcoin price. Generally, moving towards a full moon means a drop in price, to a new moon price increase. Via @marenaltman

42/50 In the past 3 out of 4 blowoff tops happened during a new moon phase

43/50 - Market narrative

44/50 In this chart I describe what I think will be the market narrative of Bitcoin for the upcoming period

45/50 - Final thoughts
46/50 Considering the macro-economic situation with inflation soaring. The scenario I’ve explained in this thread makes the most sense IMO. Bitcoin is built as hedge against inflation but even more, a safe haven in economic uncertain times, just like gold.
47/50 That’s one of the reasons why we see exchange balances decreasing since March 2020. But this new paradigm could lead to a multiyear bull market because of high demand and low supply for a long time.

48/50 But what about the Stock-2-flow model? @100TrillionUSD says himself time dependent models like S2F are less reliable. Next to that it’s a scarcity model, and does not take in account demand, like e.g. @woonomic, @RaoulGMI or @Timmerfidelity also say

49/50 The Stock-2-Flow Cross Asset model (S2FX) however is time independent. According to my prediction Bitcoin would go to 550k – 820k. A 525k Bitcoin is about 10 Trillion marketcap right now, so we could hit the S2FX target this cycle (black line on chart)

50/50 Finally. I still could see diminishing returns play out in my scenario, however I’m conflicted because of e.g. the Dow Jones moves in a 100 year log channel. Does inflation cancel out diminishing returns? Will Bitcoin eventually move in a fixed channel after xx years?

• • •
Missing some Tweet in this thread? You can try to
force a refresh


