
So @NateHindman, @MBRichardson87, @ngwelchx and I wrote a paper on Impermanent Loss in Uniswap v3, and we even got it published on Arxiv 😉
arxiv.org/abs/2111.09192
arxiv.org/abs/2111.09192

(full disclosure: my co-authors work for @Bancor, I am a senior advisor, and Uniswap is a competing protocol; there is certainly an interest here -- which is to educate the market about IL because this is where Bancor is different)
@Bancor (by the way -- all our data is publicly available, and we made an effort to document our methodology and sources in the paper; please feel free to ask if anything is unclear)
So what is IL? It is essentially the difference that your AMM LP position experiences against HODL and it generally looks like in the chart below

Note that for small ranges typically found in tradfi assets it is not that bad; the x axis here is 2x, 3x, 4x etc so IL only bites on one asset moons (or the other craters).
It is also only "impermanent" if the mooning asset falls back to earth...
It is also only "impermanent" if the mooning asset falls back to earth...
Also it is only impermanent if you do not cut your position or, in Uniswap v3, you do not adjust your range. Otherwise your IL is crystallised and definitely no longer impermanent. Quite the opposite: you reset yourself to the apex of this chart, ready for a new ride

a short explanation what Uniswap v3 actually is: fundamentally it is just a good old k=x*y AMM like Bancor and Uniswap v2, but with a twist
1/ an LP position only provides liquidity within a specified range; outside of this range it does no longer facilitate trading
1/ an LP position only provides liquidity within a specified range; outside of this range it does no longer facilitate trading
more importantly, 1/ allows to apply leverage to the position because you know how much liquidity is needed at the boundaries. So we have
2/ The position is levered by removing all liquidity that can no longer leave the standard k=x*y AMM because the trading range is limited
2/ The position is levered by removing all liquidity that can no longer leave the standard k=x*y AMM because the trading range is limited
this leads us to our corrolary
3/ outside the range, the pool is 100% in one asset; and this asset is the asset that underperformed
For example, and ETHUSDC AMM will be 100% in ETH if the ETH price in USD is below the range, and 100% in USDC if the ETH price is above
3/ outside the range, the pool is 100% in one asset; and this asset is the asset that underperformed
For example, and ETHUSDC AMM will be 100% in ETH if the ETH price in USD is below the range, and 100% in USDC if the ETH price is above
so this is how a Uniswap v3 portfolio looks: on the x axis is the price, on the y axis the portfolio value and the 3 graphs correspond to three ranges symmetric around a price of 100 (in multiplicative terms)

what see is that
- on the risk asset downside the position is "delta 1" in the risk asset (and delta 0 in the numeraire)
- on the upside it is delta 0 in the risk asset (everything is in the numeraire)
- in-between it is in-between
- on the risk asset downside the position is "delta 1" in the risk asset (and delta 0 in the numeraire)
- on the upside it is delta 0 in the risk asset (everything is in the numeraire)
- in-between it is in-between

so my coauthor just announced a Twitter space discussion for tomorrow (see below in your local timezone; it should be 1700 London)
https://twitter.com/MBRichardson87/status/1463148990531194886
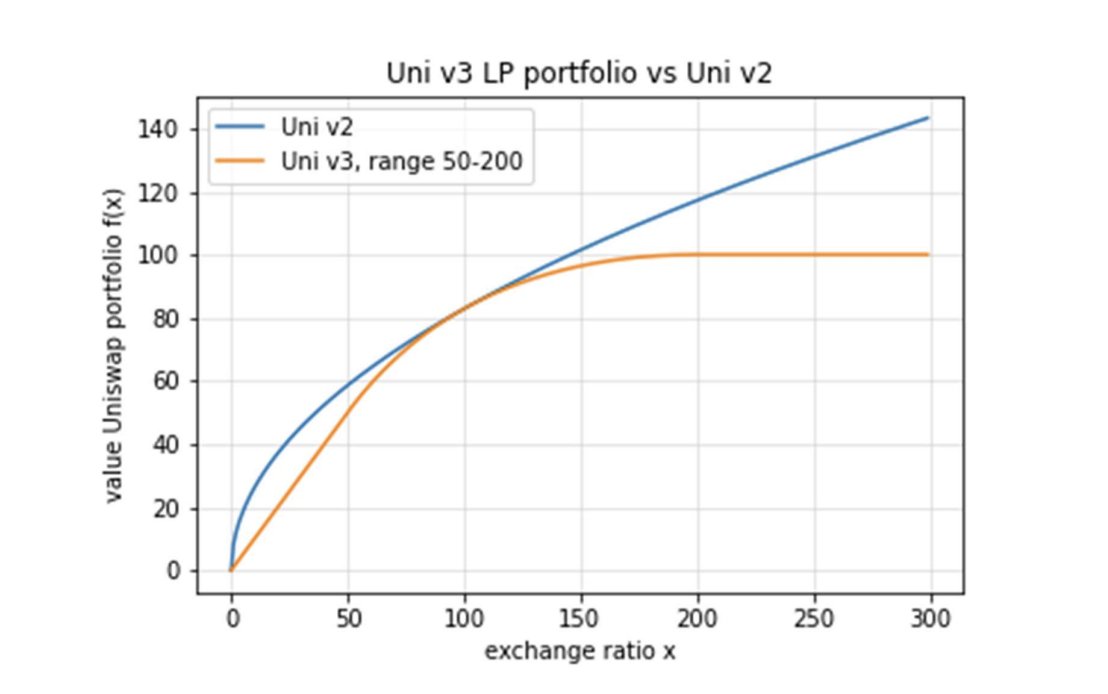
coming back, here the comparison of Uniswap v3 vs Uniswap v2, Bancor, and any other unlevered k=x*y AMM protocol. It is normalised to be tangent at a spot value of 100

What we see is that Uniswap v3 generally has more risk and v2, which makes sense given the additional leverage. More specifically
1/ in the mid section it has stronger curvature ("Gamma")
2/ beyond the top end of the range it is no upside participation (it is 100% in cash)
...
1/ in the mid section it has stronger curvature ("Gamma")
2/ beyond the top end of the range it is no upside participation (it is 100% in cash)
...

...
3/ below the lower end of the range it goes to zero faster, even though at the very end v2 catches up (both end at (0,0)
3/ below the lower end of the range it goes to zero faster, even though at the very end v2 catches up (both end at (0,0)
We then looked at the distribution of pools. Note how 75%+ of the TVL supports only 3 assets: ETH, BTC, and USD. The biggest pool outside of this is UNI with 7% and LINK with 3% of TVL (note: we exclude stable/stable here)

In terms of fews the distribution is even more skewed to the bigger pools. 83%+ of fees are with BTC, ETH, USD trading (again, excluding stable/stable)

an interesting aside: see how the 5bp USDCWETH pools is cannibalising the 30bp pool: together this one pair, ETH vs USDC, is almost 60% of Uniswap v3's trading volume (excluding stable/stable). However, of course the fees in the 5bp pool are much lower.
(interesting question for further work: why do people trade in the 30bp pool? Hypothesis of course being that there is less slippage for the trades considered)
moving on to the meat...
here is the fees per pool chart again, but as columns rather than a pie
how will it compare against the Impermanent Loss?
(if you want to find out, rejoin us after the commercial break)
here is the fees per pool chart again, but as columns rather than a pie
how will it compare against the Impermanent Loss?
(if you want to find out, rejoin us after the commercial break)

just kidding, we press on...
the IL chart looks pretty much like the fee chart
the IL chart looks pretty much like the fee chart

putting the charts together, we find that in almost all pools, the IL exceeds the fees, often by substantial amounts.
In other word -- LPs would have been better off just HODLing on to their coins rather than staking them (and that does not even include taxes)
In other word -- LPs would have been better off just HODLing on to their coins rather than staking them (and that does not even include taxes)

here the same chart with a different scale on the y axis to see better what happens beyond the five biggest pool; same story: HODL > staking

This is interesting -- I remember looking at Uniswap v2 a while back, and a lot of v2 pools were massively profitable even after IL. So what changed?
We have not studies this, but I have a strong hypothesis here: Uniswap v3 leads to an over-provisioning of liquidity because LPs do not understand their IL very well, and they only see the fees
let's take this apart: IL is driven by the effective TVL (ie the TVL multiplied with the leverage introduced by Uniswap v3). Fee income is driven by trading. Trading is somewhat driven by slippage which is driven by effective TVL.
We know that, as an LP, you should stop contributing liquidity when the marginal liquidity contributed no longer creates sufficient trading volume; the maximum risk adjusted return is where the marginal trading volume per marginal liquidity declines.
In Uniswap v3 it is quite complex to understand your IL -- many people may not even remember with what portfolio they went into the trade (the composition of the assets depends on where you are in the range)
if people don't understand their IL they are more prone to ignore it and only look at their fees; and as the fees look impressive they provision more and more liquidity, beyond the point where it would make sense, economically
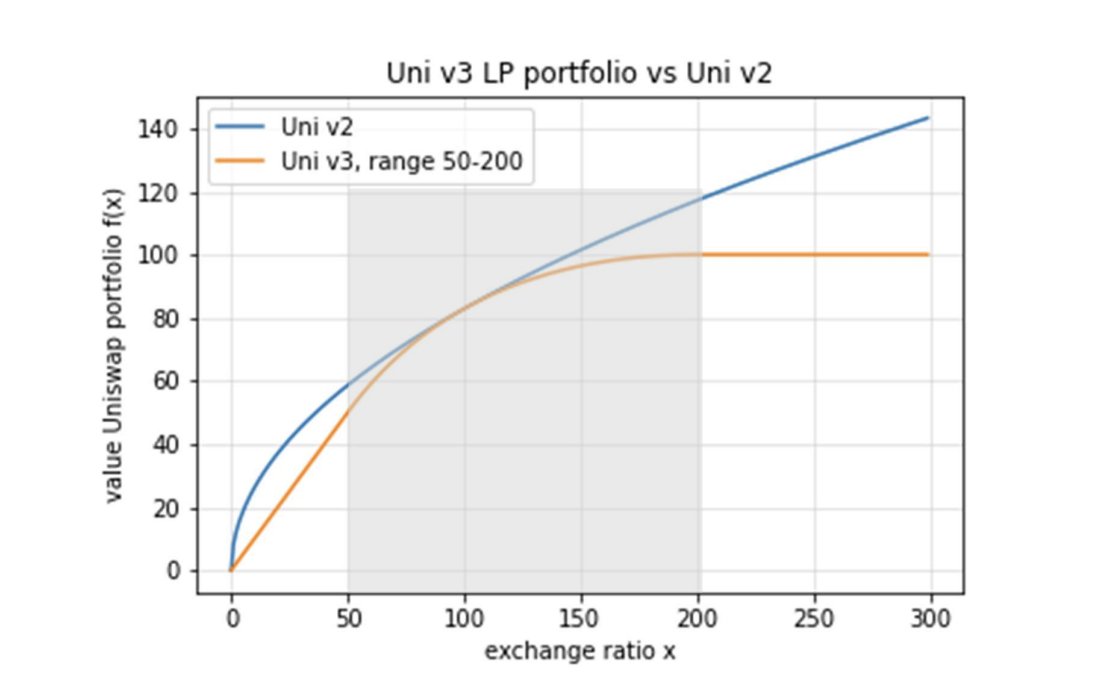
as for "sophisticated investors" there is a very interesting analysis we did; that's the same chart as above but notice the break line between "actual IL" and the "minimum IL"

to explain the difference we need to go a bit back: in Uniswap v3 there are two regions - inside the range (shaded) and outside
Inside the range the position has Gamma and earns fees, outside it is either delta 0 or delta 1 (ie 100% in the underperforming asset)
Inside the range the position has Gamma and earns fees, outside it is either delta 0 or delta 1 (ie 100% in the underperforming asset)
So having no Gamma (curvature) means you are no longer buying into a falling market. That's the good news. The bad news is that the reason you no longer buy into the falling asset is because you are already 100% invested in it

so when you are outside the range you have two options
A/ cut your position and crystallise your IL (ie it won't grow, but it also is no longer impermanent, even in the best case scenario
B/ stay invested, earn no fees, lose more if it drops more, or luck out on the upside
A/ cut your position and crystallise your IL (ie it won't grow, but it also is no longer impermanent, even in the best case scenario
B/ stay invested, earn no fees, lose more if it drops more, or luck out on the upside
so the minimum IL is essentially Option A: we only count the IL to the end of the range, and we assume that when you no longer earn fees you crystallise your IL and no longer incur new one

(side remark: there is a very interesting analysis to do what happens if you invest into very narrow ranges and keep readjusting the range at the boundary, assuming no gas or other friction. ...
... this feels a bit like delta hedging an option and our haunch is that you have the equivalent of a Theta / Gamma bleed when you readjust your ranges, but we did not get that far yet)
cc @profplum99
cc @profplum99
hunch even
anyway, so what we see here that
a/ a lot of people riding the elevator even further down than they have to, even though they do not longer earn fees, but
b/ by and large if they would act optimally and lock in their losses they would lose a bit less, but still make losses
a/ a lot of people riding the elevator even further down than they have to, even though they do not longer earn fees, but
b/ by and large if they would act optimally and lock in their losses they would lose a bit less, but still make losses

the odd one out is the 30bp ETH / USDC pool which would substantially improve. But even for this pool we are talking $60m IL (instead of $90m IL) against $80m in fees. So instead of $10m loss we have $20m gain.

now in somewhat unrelated news, when clicking on my name in Arxiv I was surprised to find my first and only theoretical physics paper in there as well. I thought it only went out in print. Should probably publish it as an NFT.
arxiv.org/abs/q-alg/9608…
arxiv.org/abs/q-alg/9608…
Moving on.
We went in with the hypothesis that big users, and/or users that will adjust their positions a lot will make better returns. We did not find any systematic evidence of that. To us it looked like noise.
We went in with the hypothesis that big users, and/or users that will adjust their positions a lot will make better returns. We did not find any systematic evidence of that. To us it looked like noise.
(now that's a good thing for your average Uniswap v3 user -- at least the big guys don't have some inherent advantage and push you even further into the red)
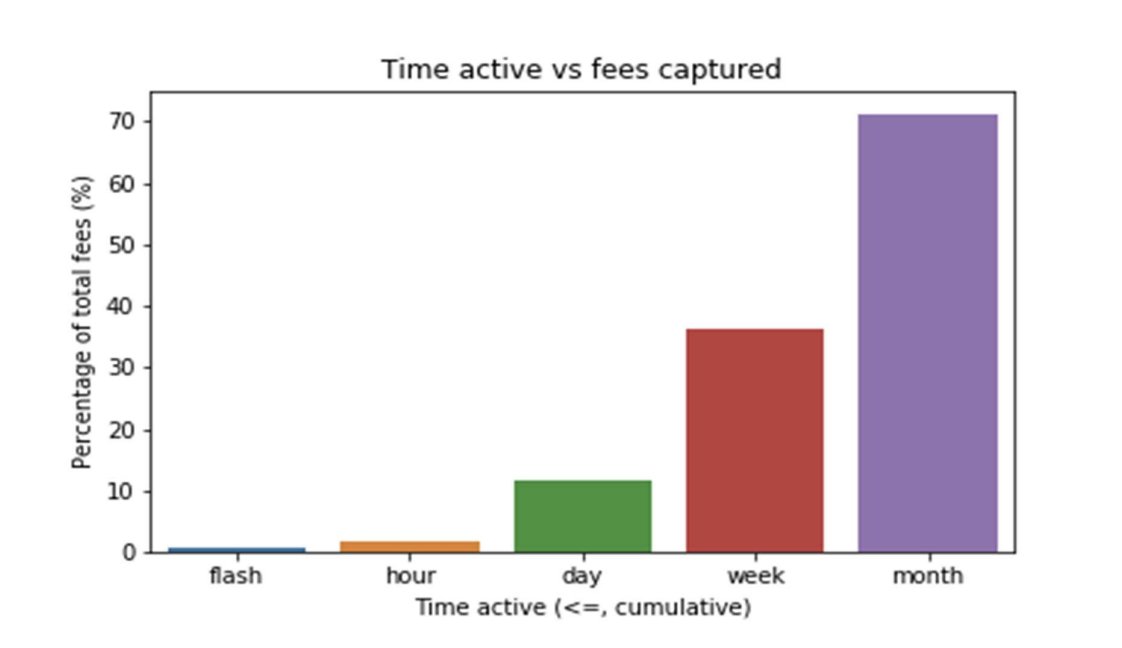
the other thing we looked at was the "tenor" of the position in lack of a better word -- ie how long it was open ex-post). Here the cumulative distribution of the number of positions. So 70% of all positions were under a months, 55% off under a week etc

here is the same chart, but with total fees captured; note that when you compare this with the above the bars go down towards shorter times -- but maybe not enough (because a 1m position should earn 4x what a 1w position earns)
This chart is now the marginal view rather than the cumulative view (blue) and we've added IL (orange). IL outweighs fees at all horizons (except flash which is intra block, for obvious reasons)

What is interesting whilst no cohort has fees > IL, the long tenor cohorts almost get there. What this suggests is what we've already discussed in the v2.1 paper, which is that IL (a-square-root-or-better shape in time) will eventually be dominated by fees (linear in time)

(that would probably assume that you need to stay within range though; outside the range, as discussed above, you can still suffer losses but you do not earn any fees)
• • •
Missing some Tweet in this thread? You can try to
force a refresh


