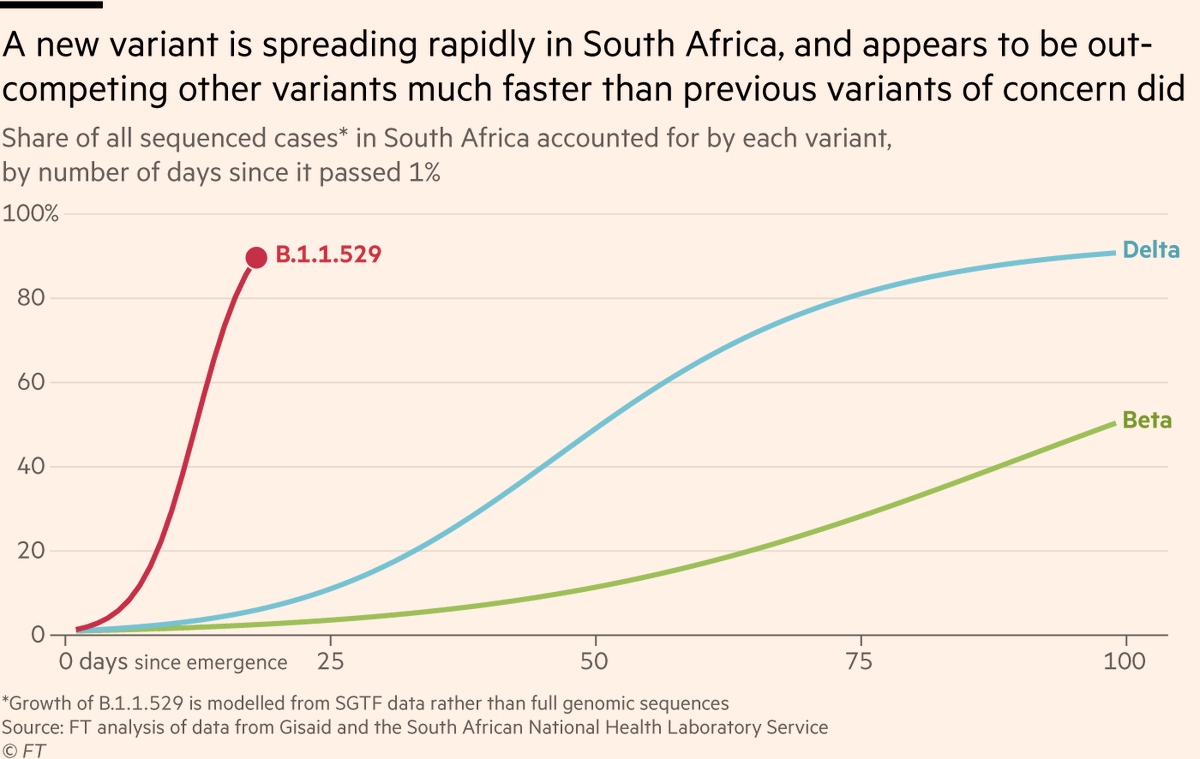
Okay folks, still lot of uncertainty around severity of disease, but here’s what I’ve gleaned from latest data and many chats that @mroliverbarnes and I have had with the brilliant, tireless doctors & public health officials in South Africa ft.com/content/d315be…
Thread follows
Thread follows
Newest stuff first:
Data from @nicd_sa show that in Gauteng province, the share of Covid-positive patients in ICU or on ventilators is somewhere between 2-3x lower than it was at the same stage of the Delta wave 🤞
Data from @nicd_sa show that in Gauteng province, the share of Covid-positive patients in ICU or on ventilators is somewhere between 2-3x lower than it was at the same stage of the Delta wave 🤞
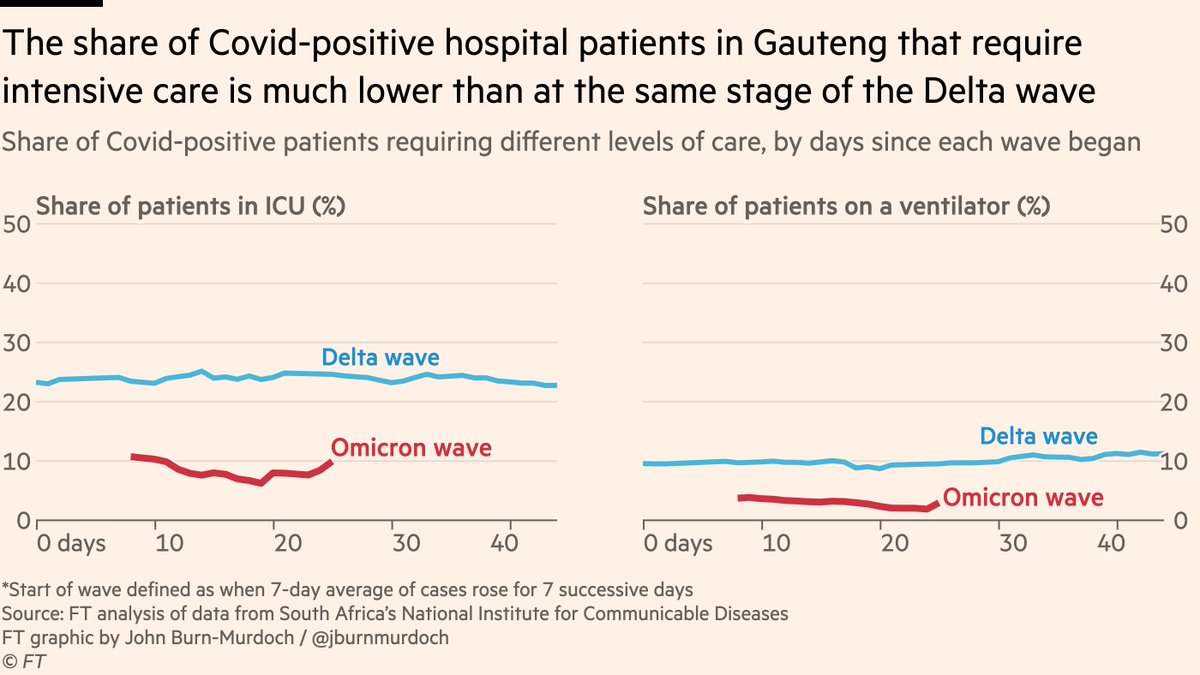
This suggests a reduction in severity of outcomes, and we see something similar when we look at length of stay in hospital:
@nicd_sa gave me data today on admissions & discharges, and it’s clear that the gap between the two is shorter for this wave, suggesting milder illness 🤞
@nicd_sa gave me data today on admissions & discharges, and it’s clear that the gap between the two is shorter for this wave, suggesting milder illness 🤞

Both of these patterns support what we heard over the weekend from @fareedabdullah0 and co, whose report from a Covid ward in Tshwane emphasised that a much lower share of Covid+ patients needed high levels of care, and their time in hospital was shorter samrc.ac.za/news/tshwane-d…
But as always, we need to consider not only the share of patients with severe disease, but the absolute number:
Unlike total Covid-positive patient numbers, which are close to Delta levels, the numbers in ICU and on ventilators are low, though they are rising too.
Unlike total Covid-positive patient numbers, which are close to Delta levels, the numbers in ICU and on ventilators are low, though they are rising too.

Those recent rises are clearer when plotted on a log scale, and we can see that if growth rates are sustained in the coming weeks (very far from guaranteed), the sheer volume of admissions could mean similar numbers of Covid patients in ICU
Small % of large number blah blah blah
Small % of large number blah blah blah

But another crucial point made in @fareedabdullah0 report was that the majority of patients on the Covid ward were actually admitted for other reasons (though NB all receiving oxygen for Covid were unvaxxed).
There are several aspects of this that are worth discussing:
There are several aspects of this that are worth discussing:

First, there has been much head-scratching over the apparent contradiction between that finding, and the finding in Tshwane-wide hospital data that over the same period of time "Most (87%) patients were admitted for COVID-19 symptoms" nicd.ac.za/wp-content/upl…
.@fareedabdullah0 believes this is likely due to different definitions: some hospitals record a patient as being admitted for Covid only if it is the sole reason for admission. Others may record "for Covid" if patient has visible symptoms regardless of primary cause of admission.
Another factor is that data on reason for admission was only recorded for 65% of patients, so strictly speaking rather than knowing that 87% of admissions were for Covid, we know that somewhere between 57% and 92% were admitted for Covid (by some definition of "for Covid").

Whatever the true number, it matters for two reasons:
First, if a chunk of Covid+ patients are not in for Covid and would have been admitted anyway, then they are not adding to hospital pressure. Say 70% are admitted for Covid, creating additional load, but maybe 30% are not.
First, if a chunk of Covid+ patients are not in for Covid and would have been admitted anyway, then they are not adding to hospital pressure. Say 70% are admitted for Covid, creating additional load, but maybe 30% are not.
Second, this could be biasing *downwards* our estimates of severity.
During Delta we divided Covid ICU by all for-Covid admissions, but now we’re dividing Covid ICU by for-Covid *and a bunch of other people who didn’t know they had Covid*. Inflate denominator -> deflate severity
During Delta we divided Covid ICU by all for-Covid admissions, but now we’re dividing Covid ICU by for-Covid *and a bunch of other people who didn’t know they had Covid*. Inflate denominator -> deflate severity
Here’s how this could change the picture:
Patients line shifts down, making low numbers of ICU & vent patients (less likely to be not-for-Covid) seem less surprising.
But even with 70% incidental assumption, ICU & vent share of Covid patients is still ~2x lower than Delta 🤞
Patients line shifts down, making low numbers of ICU & vent patients (less likely to be not-for-Covid) seem less surprising.
But even with 70% incidental assumption, ICU & vent share of Covid patients is still ~2x lower than Delta 🤞

So a couple of very promising pieces of evidence for Omicron causing less severe outcomes, but once again, this does not mean "Omicron is milder".
As the endlessly helpful @rjlessells put it to us, this is what we would expect regardless given levels of immunity in South Africa.
As the endlessly helpful @rjlessells put it to us, this is what we would expect regardless given levels of immunity in South Africa.

So where does this leave us?
Well, let’s take a brief look at the less acute metrics: growth in cases, test-positivity and admissions (on log scale)...
Well, let’s take a brief look at the less acute metrics: growth in cases, test-positivity and admissions (on log scale)...
Still steep rises, but 👀 that wiggle in the cases line:
1) Let’s be cautious. Growth picked up again today after dipping yesterday
2) But if it is real, it would show why "if surge continues for x weeks" extrapolations can mislead. No wave has gone on forever, regardless of NPIs
1) Let’s be cautious. Growth picked up again today after dipping yesterday
2) But if it is real, it would show why "if surge continues for x weeks" extrapolations can mislead. No wave has gone on forever, regardless of NPIs

Analysis by @lrossouw and @pieterstreicher suggests the current wave in Tshwane, and Gauteng more broadly, may peak in next two weeks
As they demonstrate, if that happens, number of people in ICU for Covid is exceptionally unlikely to reach Delta levels.
https://twitter.com/pieterstreicher/status/1468290454575792129
As they demonstrate, if that happens, number of people in ICU for Covid is exceptionally unlikely to reach Delta levels.
To conclude
• Data suggests share of Covid cases developing severe disease is lower than with Delta
• But lots of assumptions involved in putting a specific number on the reduction
• This doesn’t necessarily mean "Omicron is milder", it’s also consistent with immune protection
• Data suggests share of Covid cases developing severe disease is lower than with Delta
• But lots of assumptions involved in putting a specific number on the reduction
• This doesn’t necessarily mean "Omicron is milder", it’s also consistent with immune protection
Things to ponder:
• Lot of differences between South Africa and e.g UK. Age profile, vax, what variants people been infected with. All could affect how patterns from SA translate elsewhere
• Uptick in ICU and vents in recent days could be due to cases spreading to older groups
• Lot of differences between South Africa and e.g UK. Age profile, vax, what variants people been infected with. All could affect how patterns from SA translate elsewhere
• Uptick in ICU and vents in recent days could be due to cases spreading to older groups
And finally some acknowledgements:
• Huge thanks to @fareedabdullah0 @SACEMAdirector @ShabirMadh @rjlessells @rashida_abbferr and others for taking the time to speak to us in detail
• Huge thanks to @nicd_sa for continuing to share invaluable data on the situation in SA
• Huge thanks to @fareedabdullah0 @SACEMAdirector @ShabirMadh @rjlessells @rashida_abbferr and others for taking the time to speak to us in detail
• Huge thanks to @nicd_sa for continuing to share invaluable data on the situation in SA
We have a couple more analyses of different data coming up in the next few days which we hope to shed further light on the severity question.
In the meantime please let me know if you have other suggestions for what we should be looking into here 🙏
In the meantime please let me know if you have other suggestions for what we should be looking into here 🙏
Oh, and we’ll be back on here doing a Twitter Spaces session tomorrow where we’ll discuss all of this and more. Tune in at 2pm GMT / 9am ET , and do send us your questions in advance:
https://twitter.com/FinancialTimes/status/1468295155484606467
• • •
Missing some Tweet in this thread? You can try to
force a refresh