Today we release a database showing WHERE, WHEN and HOW more than 38,000 buildings were destroyed in Myanmar's Rakhine State between 2017 & 2020.
Here is the data: bit.ly/ocellirakhine. Here is an explainer thread on the work by @ocelliproject @KayleighRuiter & @C4ADS👇🛰️
Here is the data: bit.ly/ocellirakhine. Here is an explainer thread on the work by @ocelliproject @KayleighRuiter & @C4ADS👇🛰️
The data has been turned into a visualisation and interactive website by @C4ADS & @Jack_Mrgln. We wanted to make sure that this data is accessible to all levels of researchers, so please do click around and use it to further your investigations & research ocelli.c4ads.org/datainteractive 


First, WHO are we?
We're a group of volunteers (yes we do this in our spare time) specialised in mapping and databases. You can see more of what we do at @ocelliproject.
We focus on making publicly available geodatabases to help journalists, investigators and researchers.
We're a group of volunteers (yes we do this in our spare time) specialised in mapping and databases. You can see more of what we do at @ocelliproject.
We focus on making publicly available geodatabases to help journalists, investigators and researchers.

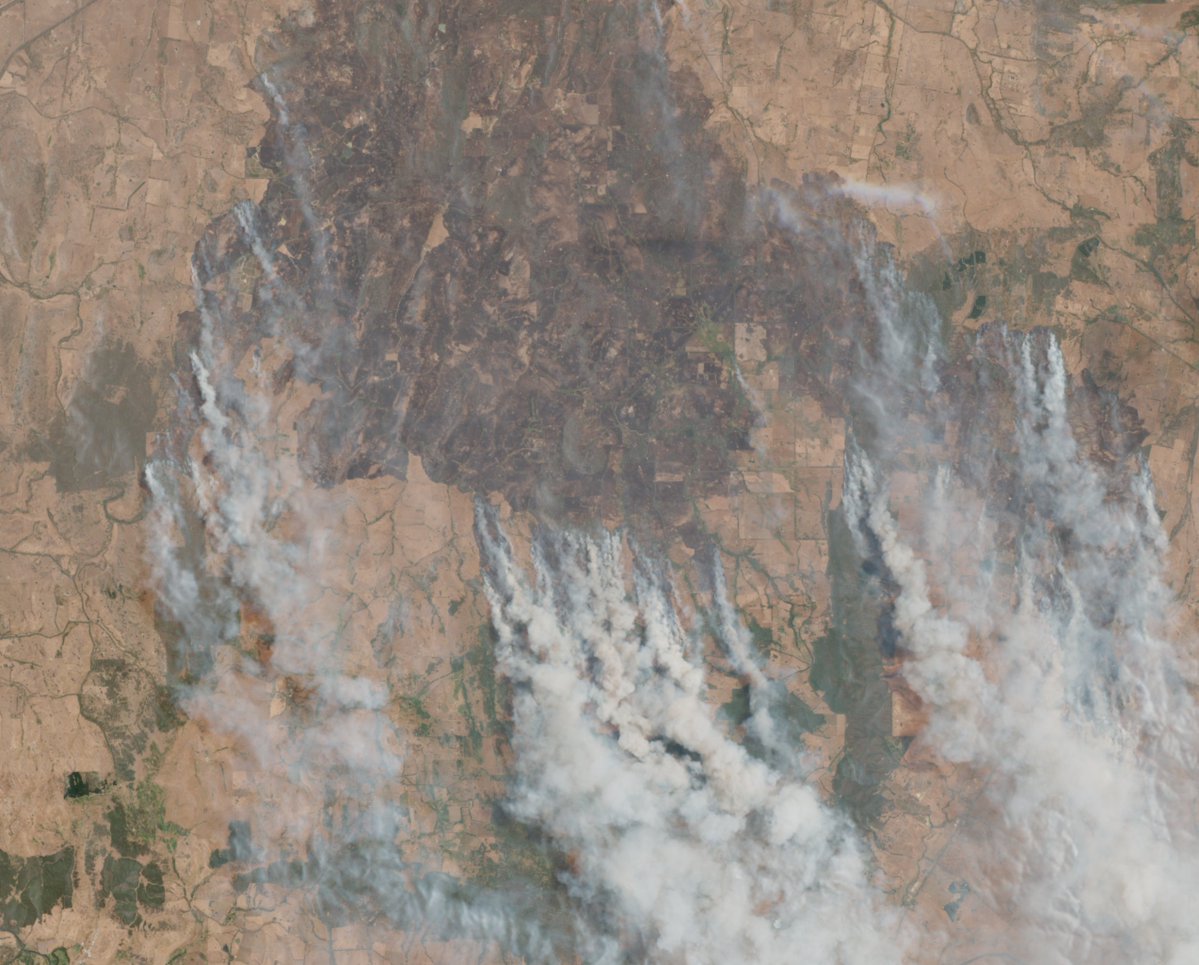
WHY did we do this? One look at Rakhine on @googleearth shows scores of villages wiped off the map.
We felt a need to build a freely available dataset documenting every single building with a transparent methodology that could be replicated by anyone.
We felt a need to build a freely available dataset documenting every single building with a transparent methodology that could be replicated by anyone.
There has been numerous independent sources of research done in the past, but there's still so much work to do in documenting the horrific story of what was referred to as "a textbook example of ethnic cleansing" ohchr.org/EN/NewsEvents/…

This work is important given the current activity in Myanmar's North where numerous villages and buildings have been burned to the ground.
Through work we do at @MyanmarWitness we're concerned about what happened in the past & #WhatsHappeningInMyanmar
Through work we do at @MyanmarWitness we're concerned about what happened in the past & #WhatsHappeningInMyanmar
https://twitter.com/MyanmarWitness/status/1468581336717922311?s=20
HOW did we do this project? We followed the six steps seen in the graphic below and we've made this workflow replicable for other subjects that require this approach to large-scale documentation.
Here is a link to our full @ocelliproject methodology: drive.google.com/drive/folders/…
Here is a link to our full @ocelliproject methodology: drive.google.com/drive/folders/…

Our workflow is based on dividing imagery analysis over a team. How?
We conducted an initial sweep of the area, layered a grid and divided the area up amongst volunteers to go through each square kilometre. We were able to cover 3,283 square kilometres in that manner.
We conducted an initial sweep of the area, layered a grid and divided the area up amongst volunteers to go through each square kilometre. We were able to cover 3,283 square kilometres in that manner.


WHAT did we find by doing this? You can see all of our results in this spreadsheet: bit.ly/ocellirakhine & data interactive: ocelli.c4ads.org/datainteractive.
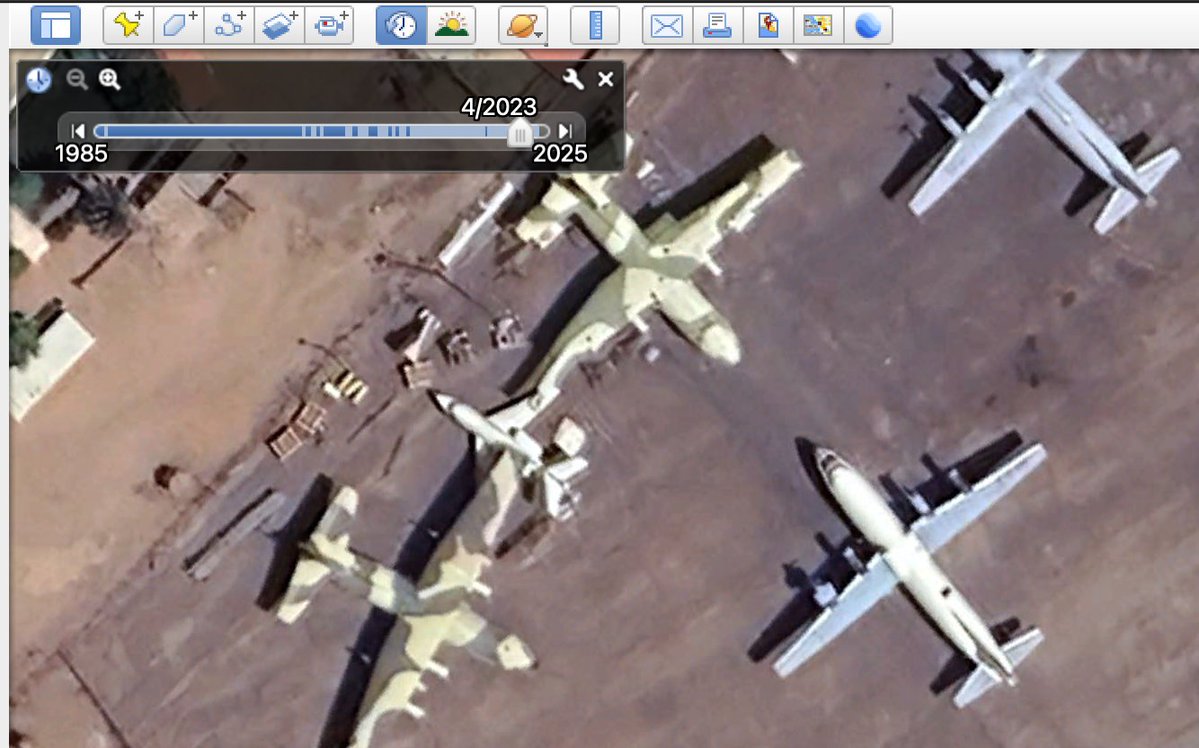
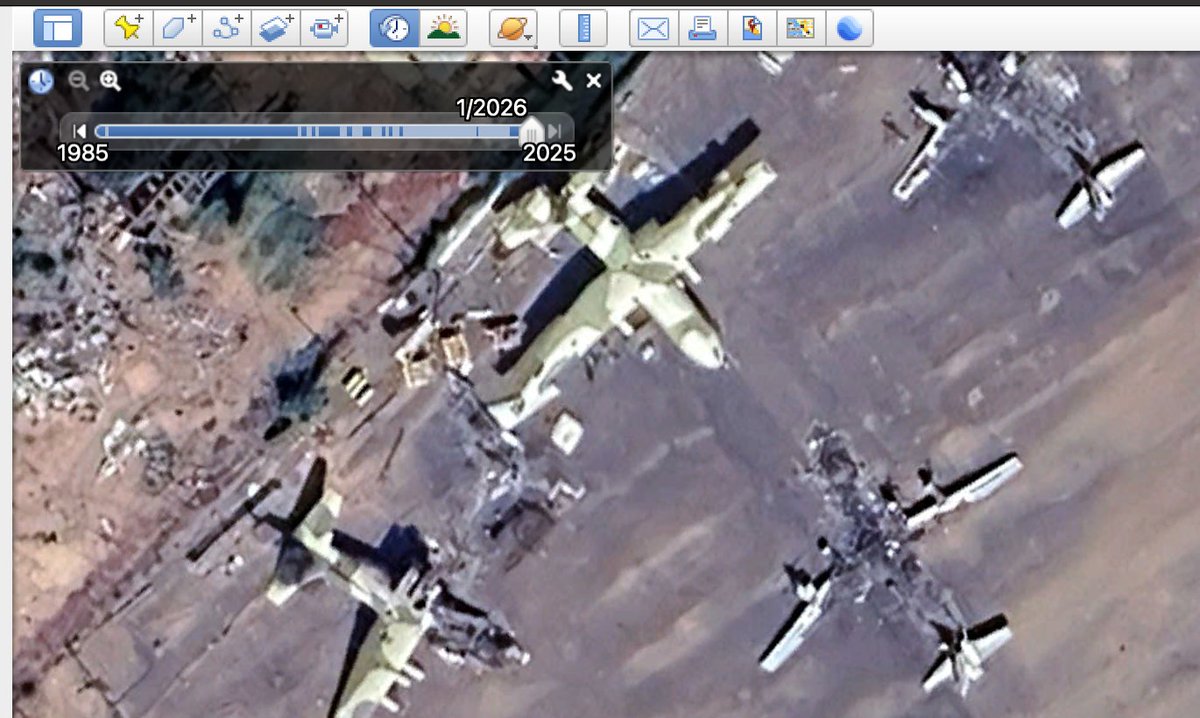
The data interactive shows satellite imagery of before and after the destruction occurred.
The data interactive shows satellite imagery of before and after the destruction occurred.


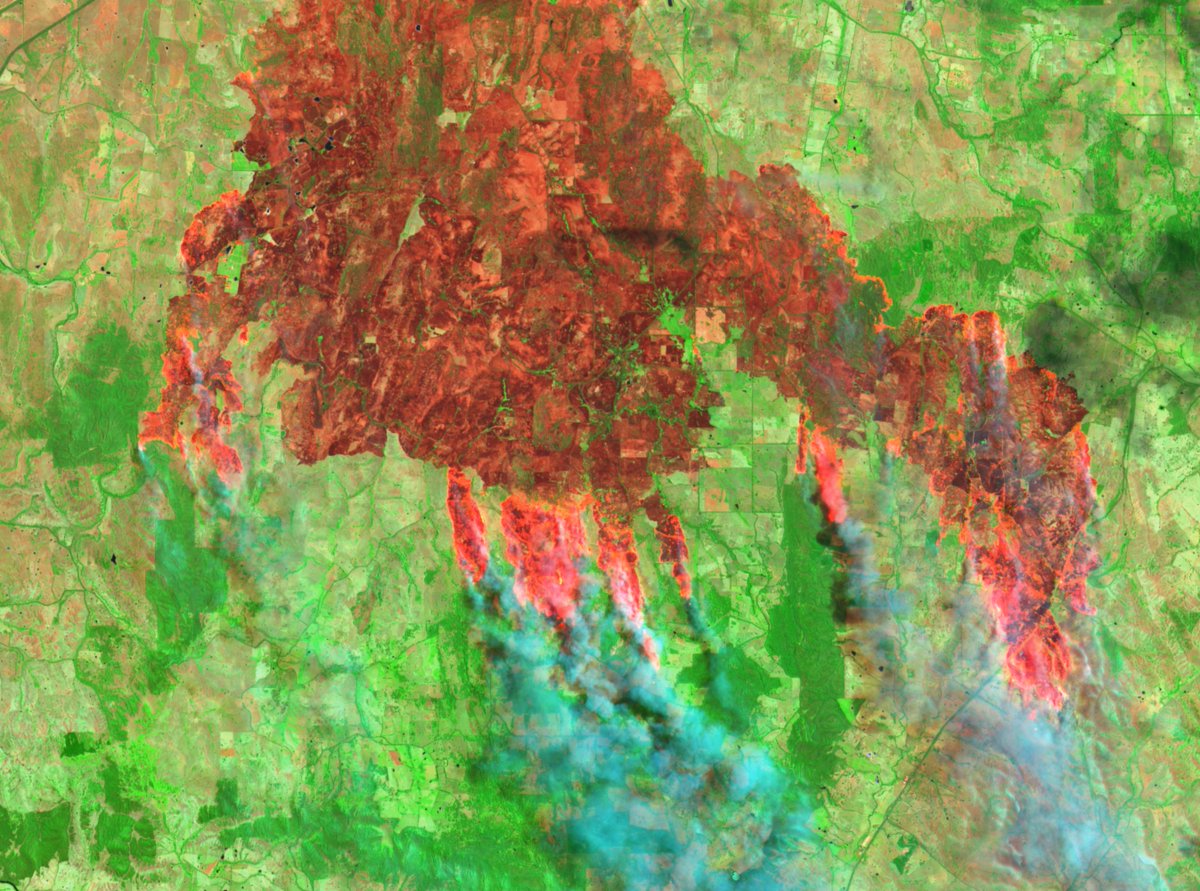
As a result of doing this documentation we identified more 38,000 destroyed buildings, more than 24,000 of which had clear burn marks as seen in @googleearth satellite imagery.
We cross-referenced all of our findings with @sentinel_hub imagery. We used freely available satellite imagery in this project for transparency & replicability of findings.
Where possible, we've added timelapses of the destruction such as this one from Myo Thu Gyi
Where possible, we've added timelapses of the destruction such as this one from Myo Thu Gyi
Building off the back of amazing work by @Nrg8000 & @elisethoma5 @ASPI_org (pageflow.aspi.org.au/rakhine-state#…), we documented significant land clearing and when new buildings popped up on top of where villages were destroyed.
You can see that analysis here: ocelli.c4ads.org/investigations
You can see that analysis here: ocelli.c4ads.org/investigations
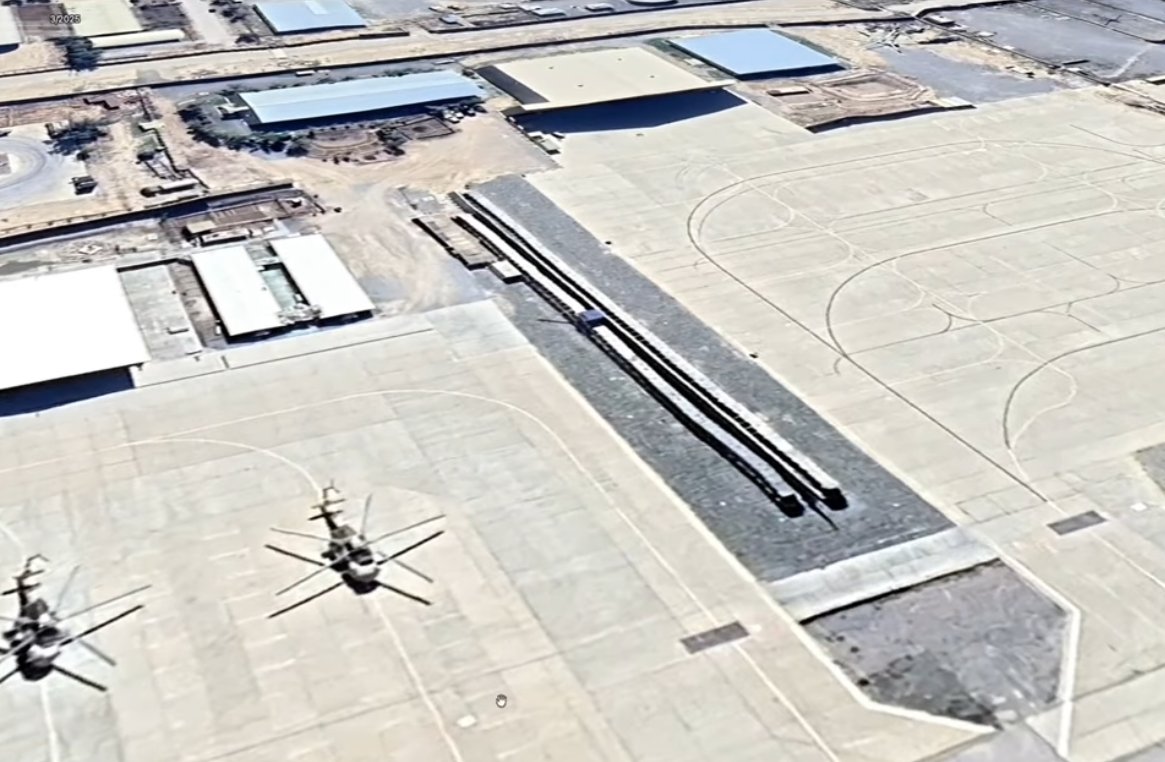
For example, here is one interesting location where villages were destroyed and land was completely cleared. This location is here:
goo.gl/maps/n9hbRegRY… around the Anauk Myinhlut and Al Le Than Kyaw area.
goo.gl/maps/n9hbRegRY… around the Anauk Myinhlut and Al Le Than Kyaw area.


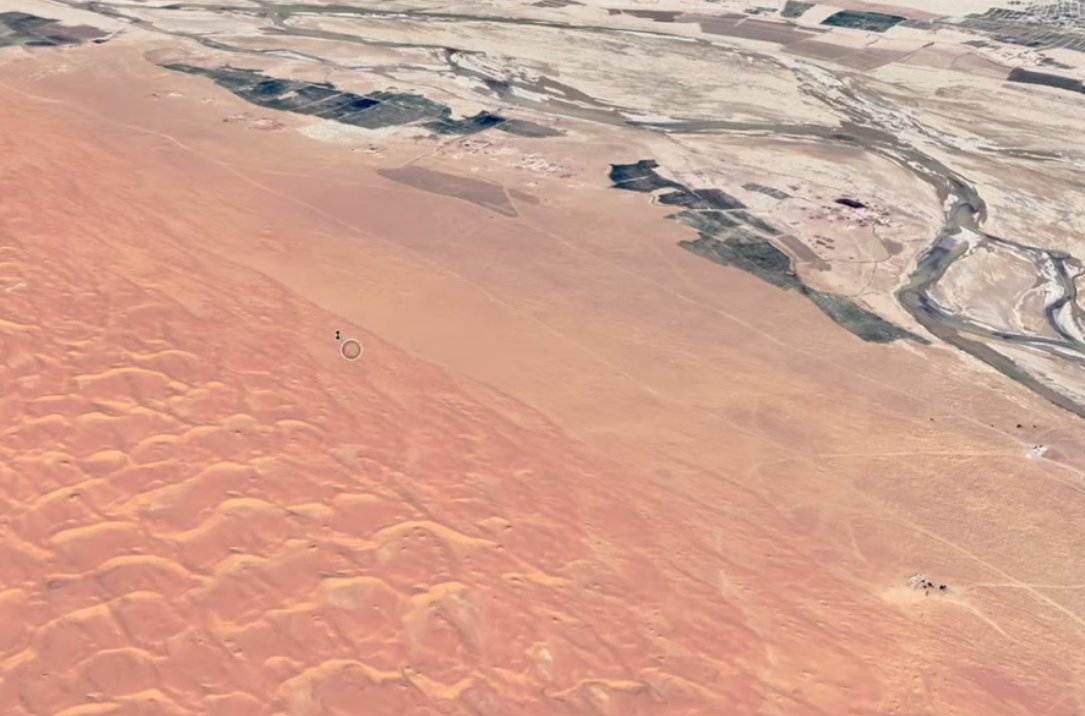
Observing areas like this is important, as we have also identified changes along the coastline and small encampments where villages were destroyed and cleared.


We've documented a lot more of new constructions that you can find in the second tab of the spreadsheet here: bit.ly/ocellirakhine
If anyone is doing further work on investigating Rakhine State - we hope this will be helpful.
If anyone is doing further work on investigating Rakhine State - we hope this will be helpful.

If you want to get your hands on the KML and see the annotations on @googleearth yourself, the KML is in this drive folder: drive.google.com/drive/folders/…
We have made all of the data accessible in this drive: drive.google.com/drive/folders/….
In there you will also find before and after imagery of every site - we hope that this type of database might assist anyone looking for large datasets for potential development fields
In there you will also find before and after imagery of every site - we hope that this type of database might assist anyone looking for large datasets for potential development fields


This project would not have been possible without the countless days/weeks/months of dedication from @KayleighRuiter - give her a follow as she is an incredible analyst and makes an epic spreadsheet (here's the proof: docs.google.com/spreadsheets/d…)
https://twitter.com/KayleighRuiter/status/1352651223955107845?s=20
Also a massive kudos to the wider volunteer team that worked on the @ocelliproject documenting change in Rakhine State: @hrgwilson1, Gavin de Ruiter, @anant_saria, @TomTomjarvis, @bullock_milo, @JKPoupon, @jadolecek, Paul Gruet, Tineke Ellens
There's a lot of resources in this thread, all of which are on the @ocelliproject & @C4ADS website here: ocelli.c4ads.org.
We hope this work inspires future investigations, research and strengthens justice & accountability for what happened in Myanmar's Rakhine State.
We hope this work inspires future investigations, research and strengthens justice & accountability for what happened in Myanmar's Rakhine State.
• • •
Missing some Tweet in this thread? You can try to
force a refresh