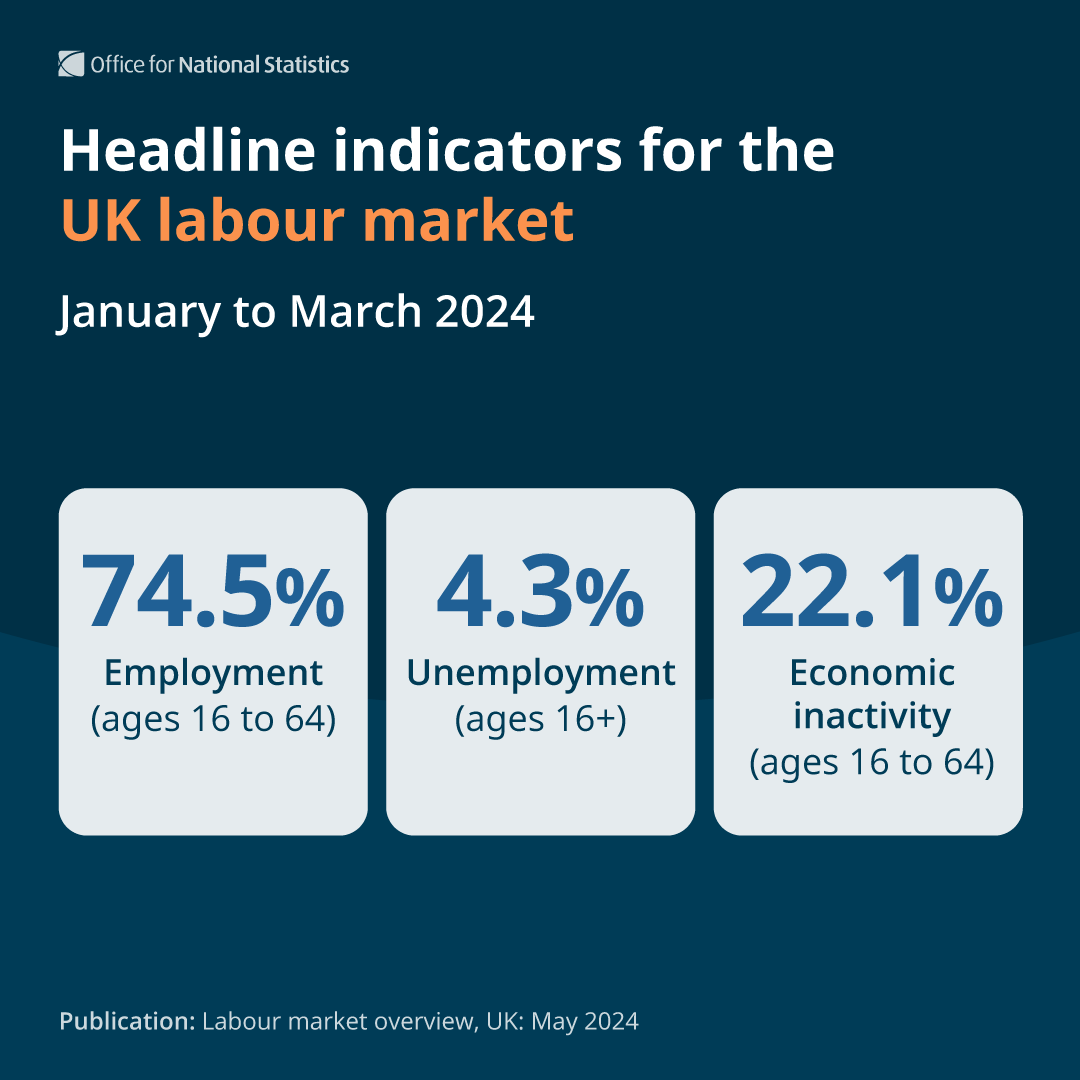
Headline indicators for the UK labour market for August to October 2021 show that
▪️ employment was 75.5%
▪️ unemployment was 4.2%
▪️ economic inactivity was 21.2%
➡️ow.ly/MgXF50Ha53b
▪️ employment was 75.5%
▪️ unemployment was 4.2%
▪️ economic inactivity was 21.2%
➡️ow.ly/MgXF50Ha53b

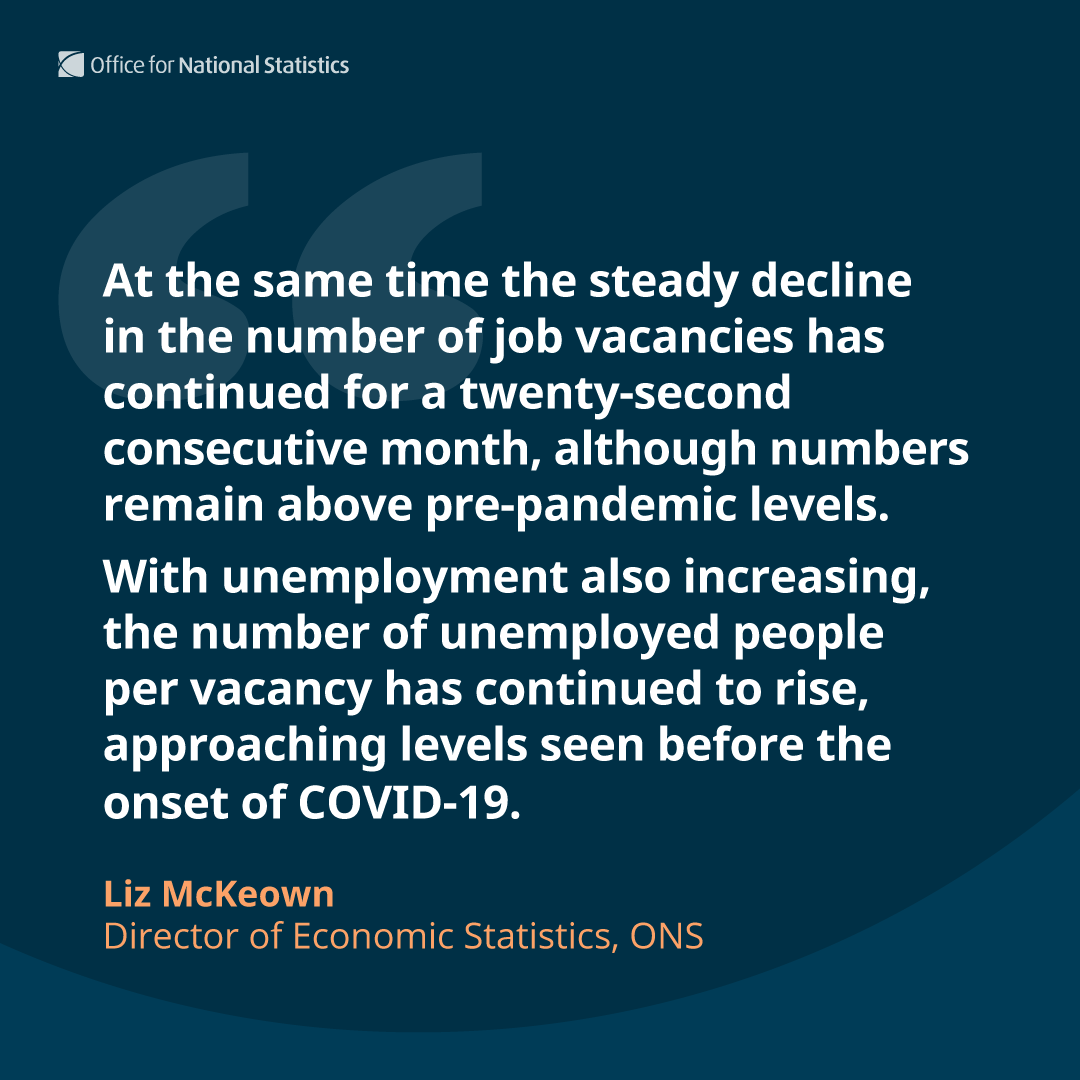
Commenting on today’s labour market data, ONS director of economic statistics Darren Morgan said⬇️
(1/4)
(1/4)

The number of employees on payroll continued to grow strongly in November 2021, with all regions now above pre-pandemic levels ow.ly/ln6N50Ha59J 

Weekly hours worked increased 17,600 on the previous quarter, to 1.024 billion hours in August to October 2021.
However, this is a smaller increase than in previous periods and is still below pre-pandemic levels ow.ly/zCuy50Ha5cy
However, this is a smaller increase than in previous periods and is still below pre-pandemic levels ow.ly/zCuy50Ha5cy

After inflation, average pay saw annual growth of 1.7% including bonuses in August to October 2021, while excluding bonuses it was up 1.0%.
Temporary factors seen earlier in the year have now largely worked their way out of the data ow.ly/TrLt50Ha5gx
Temporary factors seen earlier in the year have now largely worked their way out of the data ow.ly/TrLt50Ha5gx
There were an average of 1.219 million job vacancies across September to November 2021, up from 1.035 million the previous three months ow.ly/941t50Ha5h5 

There were 5.70 million public sector employees for September 2021, up 22,000 on June 2021 and up 137,000 on September 2020.
The increase from a year ago is largely due to the response of the NHS and the Civil Service to the pandemic ow.ly/2fet50Ha5lb
The increase from a year ago is largely due to the response of the NHS and the Civil Service to the pandemic ow.ly/2fet50Ha5lb
• • •
Missing some Tweet in this thread? You can try to
force a refresh


