
Dreaming about death; got up to make coffee
Then decided to write thread about what's killing me. Not depressing (on contrary). It's my duty to make the world understand this +ve thing before I die [not that I think I'll die soon; that was just in dream]
PLEASE READ IF YOU CAN!
Then decided to write thread about what's killing me. Not depressing (on contrary). It's my duty to make the world understand this +ve thing before I die [not that I think I'll die soon; that was just in dream]
PLEASE READ IF YOU CAN!
For more than 10 years I've been researching with collaborators (including @mlipsitch @GrahamMedley) why epidemic models tend to exaggerate epidemic sizes and overestimate intervention impacts (particularly vaccines but also NPIs):
journals.plos.org/plospathogens/…
journals.plos.org/plospathogens/…
Here a wider perspective:
arxiv.org/abs/2009.01354
arxiv.org/abs/2009.01354
Naturally when the pandemic started I with collaborators (including former students @rjaaguas @caesoma) applied these ideas to it:
medrxiv.org/content/10.110…
medrxiv.org/content/10.110…
It should not surprise anyone that exaggerated epidemic sizes we tend to see in models come with higher herd immunity threshold (HIT). HIT (proportion of population that needs to be immune before natural epidemic peaks) is also indicator of epidemic height (after simple math).
This was not to criticise any particular model. It was a general concern about way epidemic models had been built for over a century. It was an attempt to add another perspective to all modelling being done to address pandemic.
See introduction here:
medrxiv.org/content/10.110…
See introduction here:
medrxiv.org/content/10.110…
For reasons too hard for a genuine mathematician to comprehend we were politically-targeted for extermination. The pressure to demonstrate that the approach was actually usable in practice (not just an elegant mathematical construct) was monumental.
So (applying approach develop with @ecoevo_kel when she was a postdoc with me and @mlipsitch) we dedicated all our efforts to demonstrate how the proposed formalisms could be used in context of the current pandemic.
We released preprint sharing incipiente results in good faith. Attack was even more brutal; again incomprehensible to me. Ok, initial HIT estimates (10-20%) were too low (10% lower than updates we posted later) but way more accurate than the prevailing 70-80%, I think.
It felt like the most overwhelming self-organised campaign to discredit a decade of research, with some of the most accredited (and others less) mathematical epidemiologists posting casual loose statements and disengaging when we tried to address their concerns.
Almost 2 years in we have of course assessed all those criticisms (that's all I have been doing). Only one (posted by @bugwonk) showed any impact on our results (that's what made HIT increase by about 10%). That's in preprint "Frailty variation..." above but I'll try to explain.
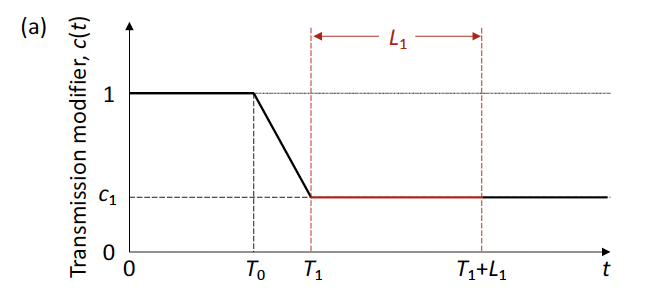
In order to fit the models to series of cases, hospitalisations or deaths (until 1 July 2020 to mimic early work) we need to account for behavioural changes (due to NPI or voluntary caution): 

t is time, T0 when behavioural change starts impact epidemic, T1 when 1st lockdown begins (study countries had lockdown in spring 2020), L1 lockdown duration (until sometime in May). After L1 we had assumed a particular slope for resumption of contacts, which led to HIT~10-20%.
Here results for England and Scotland:
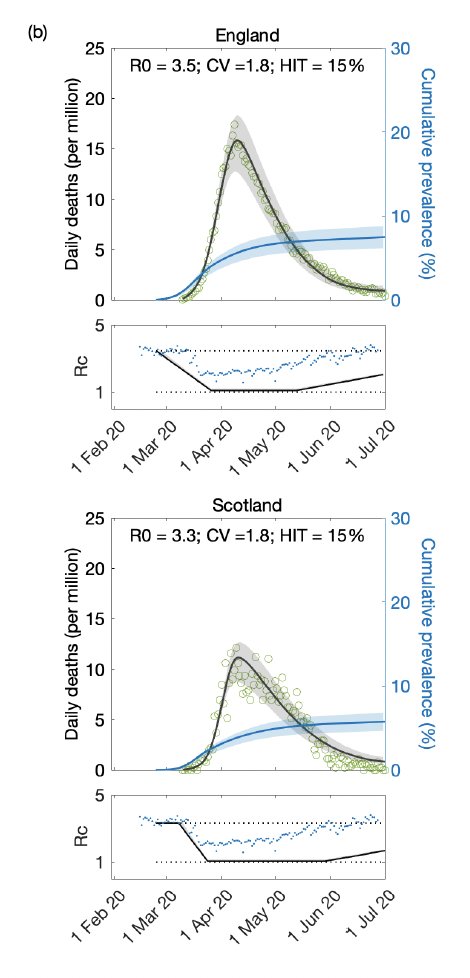
Ben pointed out that slope was probably too high (although it seemed corroborated by google mobility data; dots in Rc panels) and this would tent to lower HIT. We repeated the analyses in the most conservative scenario of no slope:
Ben was of course right; HIT came to the order of 30%:
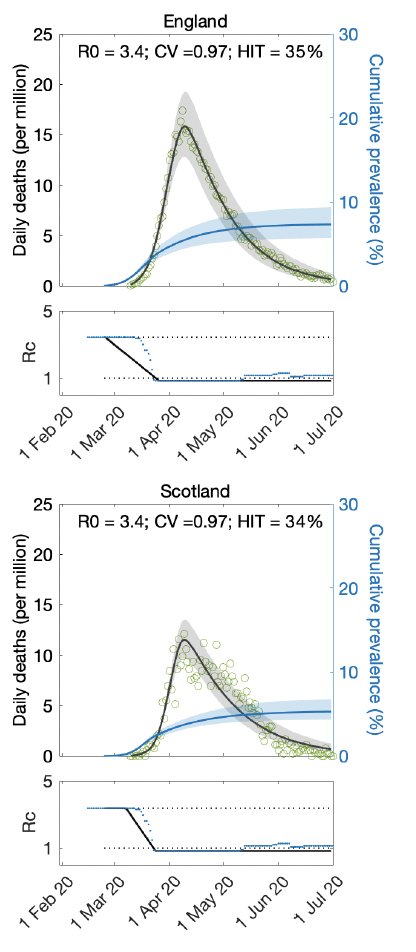
But this was a conservative scenario. The dots overlaid on the Rc panels here represent the stringency index that tracks government interventions. It is not completely flat after L1. So we repeated this using real stringency index and...
also extended the fits for longer (another request from Ben). Here is an example of what we get (we are still running fits as we revise manuscripts for journals):
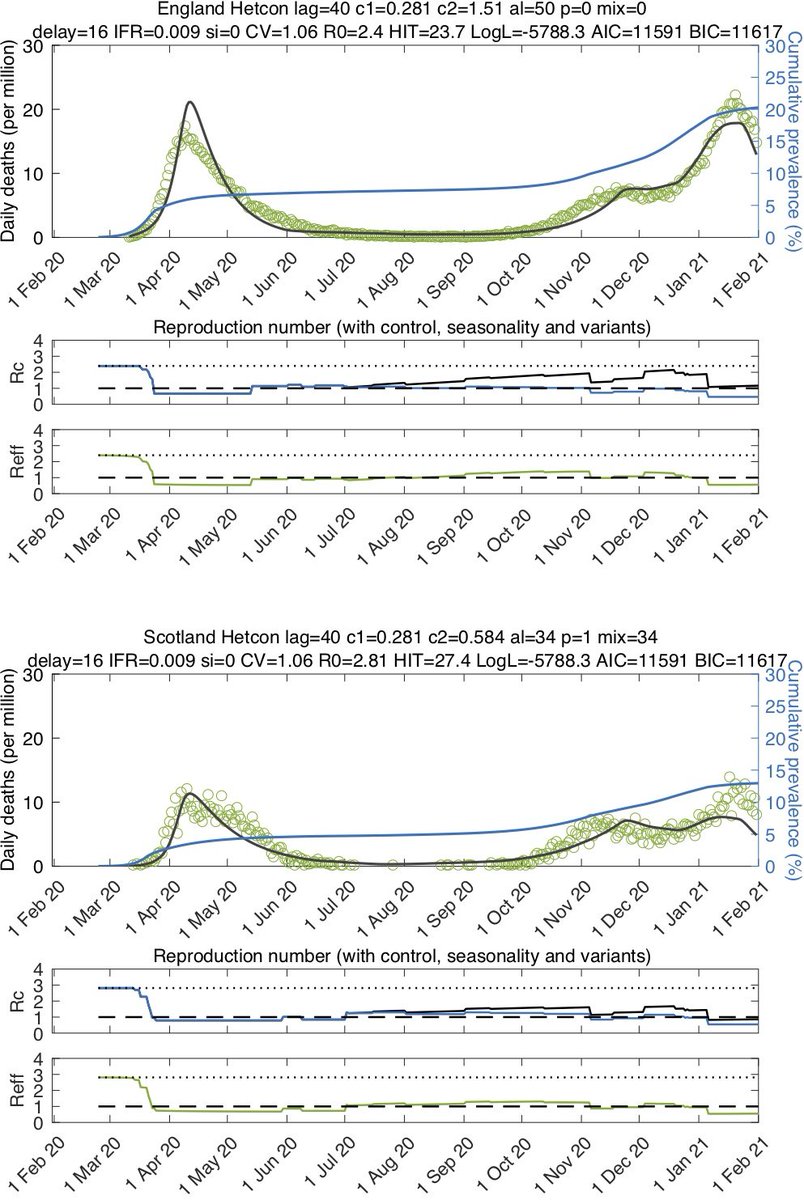
We are getting HIT~30% (in some scenarios a bit less; others a bit more). This is in contrast with claims by other researchers who used our models to check our results. They make same point as Ben about slope but I don't see HIT going as large as they say
medrxiv.org/content/10.110…
medrxiv.org/content/10.110…
As I said we are revising manuscripts for journal publications. I'll post when available. There will be other interesting additions in publications.
But bottom like is I think models are valid and useful in pandemic situations. I think many people are mistaken in saying...
But bottom like is I think models are valid and useful in pandemic situations. I think many people are mistaken in saying...
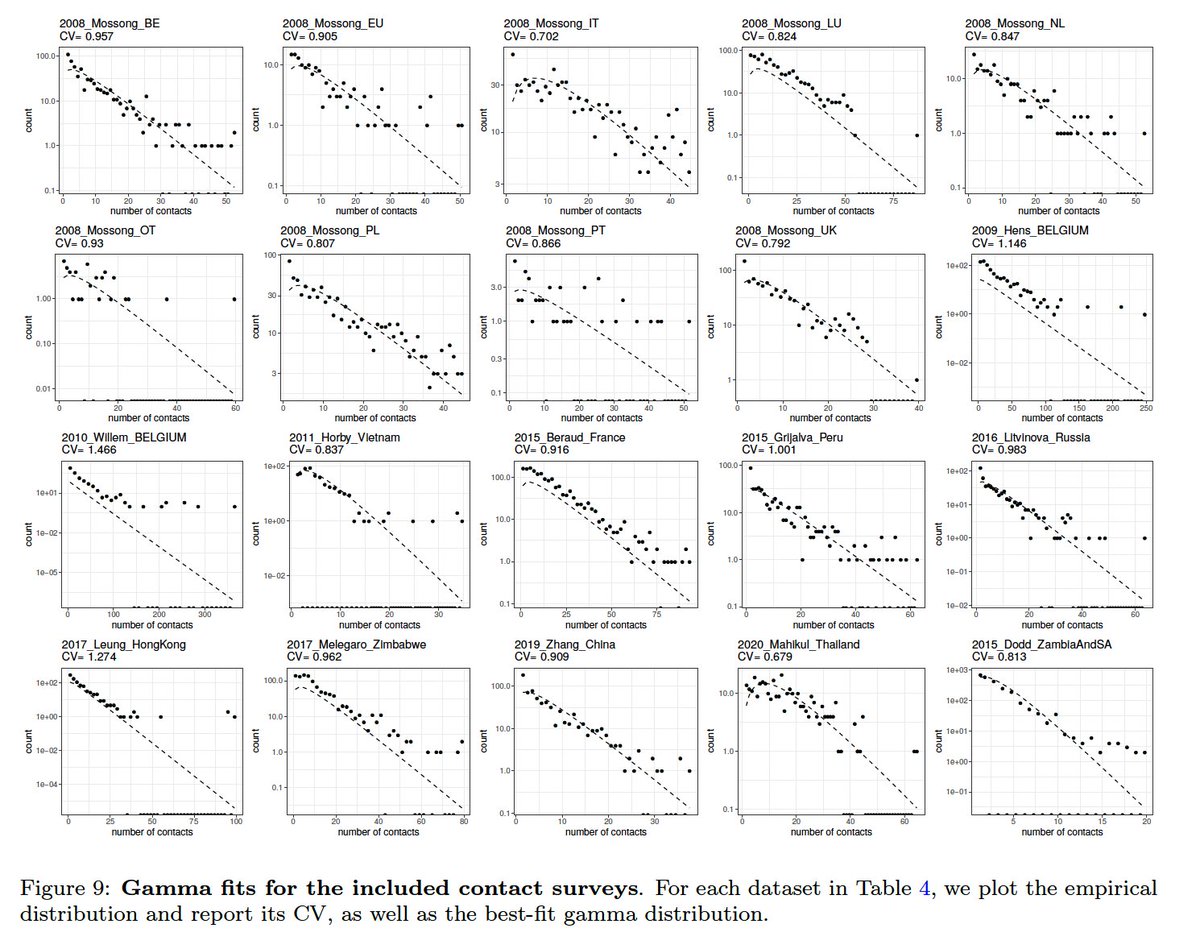
that this is beautiful theory but not of practical use due to inaptitude to infer credible parameters. One parameter that attracted a lot suspicion was the coefficient of individual variation (CV) in connectivity...
Values we were getting at the beginning were probably a bit high, but after resolving the slope issue we are now getting CV~1 as in independent contact surveys (addition from @ChikinaLab):
So PLEASE STOP dismissing our work on basis of preliminary results shared in good faith in July 2020. This is a new approach being tested (not ready off shelf). If we had been lucky to have @bugwonk as a reviewer back then the slope issue would have been fixed from the start...
and we would have spent the entire 2021 contributing more timely and usefully to address variants and vaccines. For those who don't know (or don't remember; or don't want to remember) most of my research career has been dedicated to the study of variants and vaccines.
Merry Christmas to those who made it to this point!
• • •
Missing some Tweet in this thread? You can try to
force a refresh


