In the second part of phase 1 of the @astroport_fi lockdrop users could only withdraw the LP tokens they had deposited.
And guess what. They have. The question is:
How many?
From which pools?
From which lockup periods?
Let's see 🧵👇
We counted 555 unique addresses taking advantage of this withdrawing part of phase 1.
What pools have users withdrawn from?
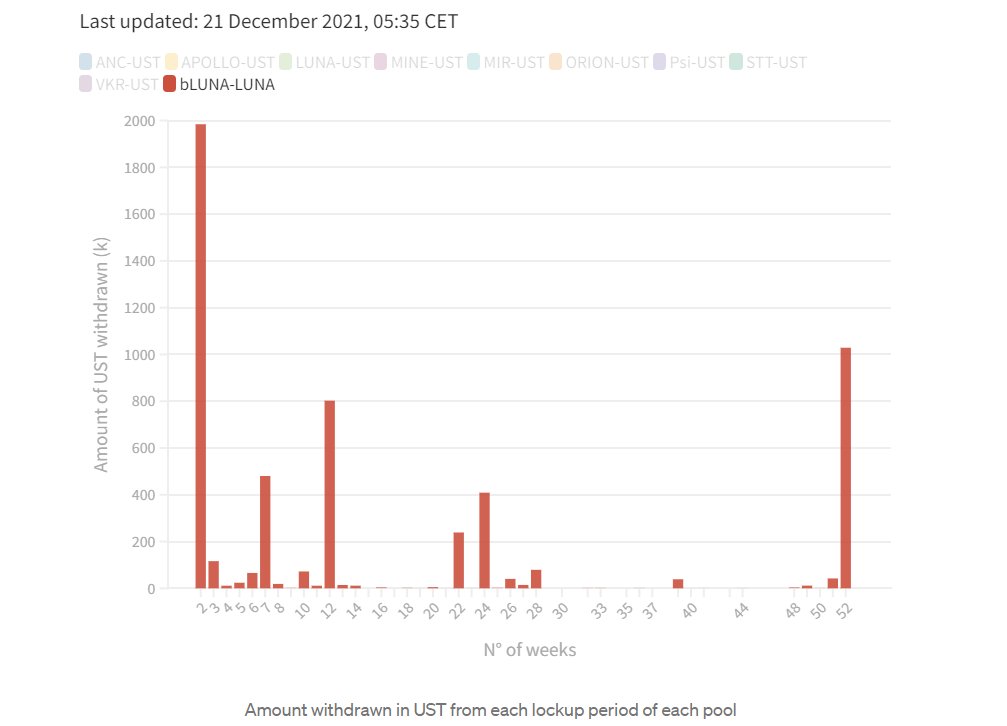
bLuna-Luna is by far the pool from which the most funds have been withdrawn: $5.5m UST and over 250 users withdrawing
This was however also the pool with most tokens locked to start with.
- ANC/LUNA-UST have interestingly similar number of unique addresses and amount withdrawn
From which lockup periods?
bLuna-Luna: the vast majority of tokens has been withdrawn from the 2 weeks lockup period. Probably this option was not providing many rewards in $ASTRO tokens, given the large liquidity locked in this pool for longer time.
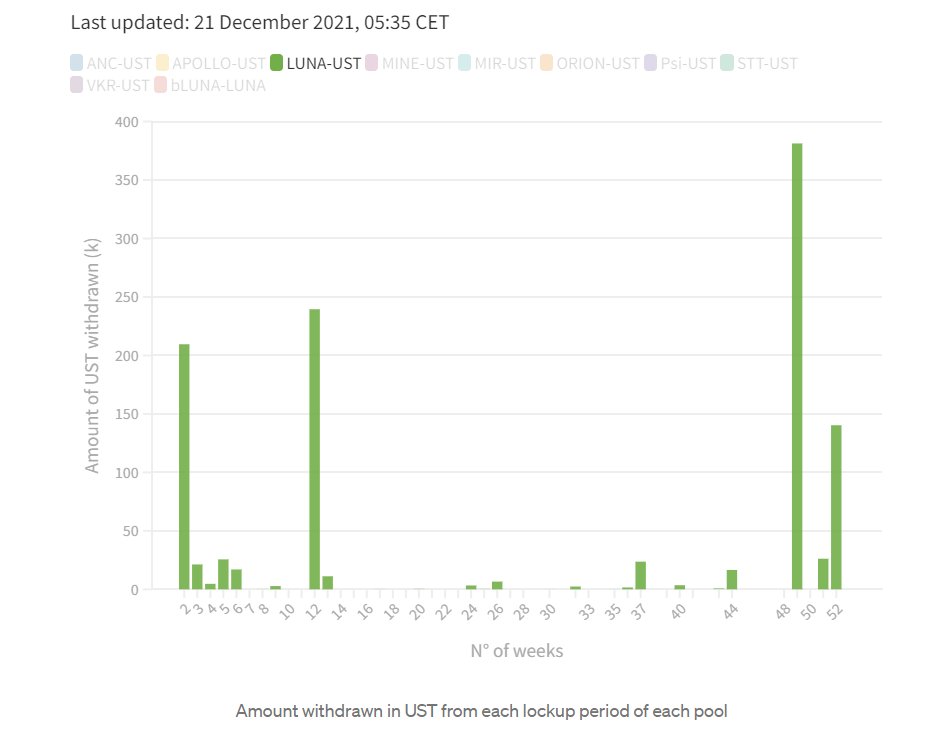
Luna-UST: the situation is different here. The large share of tokens has been withdrawn from the 50 weeks. This pair presents impermanent loss, and some users may have preferred not to be exposed for such a long time.
What percentage has each user withdrawn?
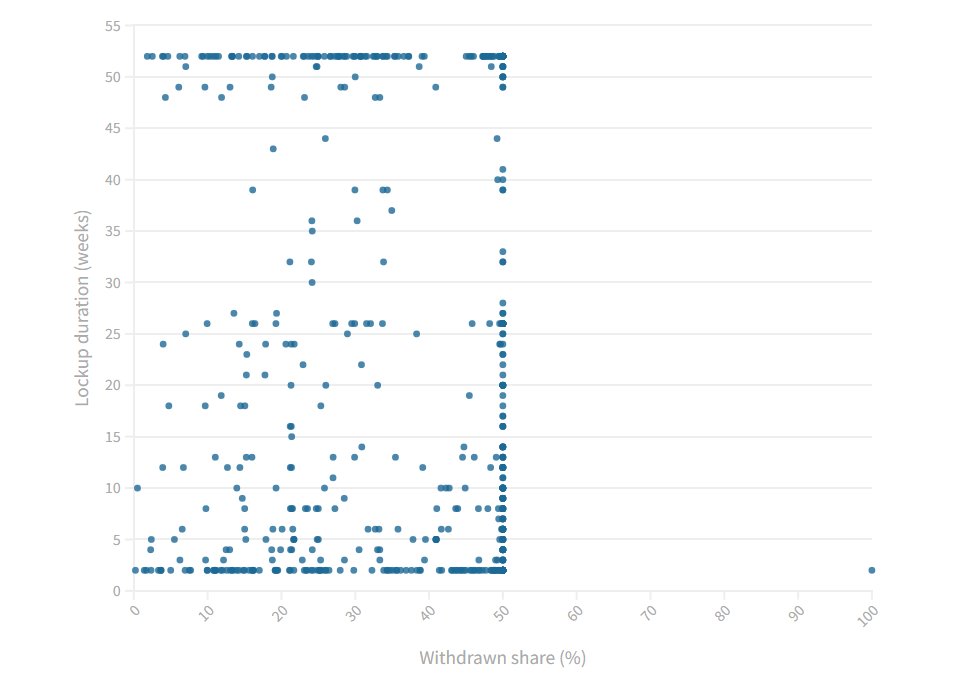
For the 555 withdrawing users, we are now interested in seeing what percentage, out of the previously deposited tokens, has each users requested to unlock.
- We can see that the most requested lockup periods are 2 and 52 weeks (Y-axis)
- 50% represents a significant value. It is the most popular withdrawn share and almost no users have withdrawn more than this (only 1 at 100%)
As always, I leave you the link to the article where you can explore the visualizations for yourself. And maybe find something out that I have missed!
The following analysis is meant to analyse the behavior of users during and after the depeg event of UST. Coincidentally, in the same days @osmosiszone started listing a new stablecoin: USDC. The question is whether users have swapped away from UST and moved to USDC
1/ 🧵
Let's start by looking at the amount of tokens swapped on the UST/OSMO pair. We can see that the amount swapped of both tokens used to range below 20M. After the depeg event however, the trading volume spiked to 120M UST and 40M OSMO.
2/
OSMO was worth around $2.5 on the spike day (11th May) which means that more UST has been swapped into OSMO. This is in line with the event: many users exited their UST position by swapping them into OSMO.
3/
Astro is looking to become a major aspect of the Terra ecosystem in the future. That is why we need to leverage the ability to access on-chain data to inspect what happens in gov (thanks @flipsidecrypto)
I therefore built this PoC dashboard (real data, tho) for @astroport_fi 1/
Astroport page gives already a lot of information on each specific proposal, but does not allow to compare them.
Let's plot the results from each proposal. Have most of the proposals passed? With what ratio of for/against votes? Which have been the most controversial ones? 2/
Single addresses might have much more power than other voters. In this chart we plot each single address who has voted for the different proposals.
Try selecting the 99 to 100 range with the slider: this will only show you how the top 1% of voters per voting power has voted. 3/
Today the $xPRISM - $PRISM has finally offered some interesting arb opportunities again
Today $xPRISM has been cheaper than $PRISM itself - although $xPRISM allows to redeem 1.03 $PRISM after 21 days of unstaking.
This got me thinking: who has created this unbalance? 🧵
1/
To investigate this, we need to start thinking at how the price in the pool might have gotten that cheap
If xPRISM is cheap in the pool with PRISM - it must be because someone has deposited a large amount of xPRISM and withdrawn the corresponding amount of PRISM
2/
But we are in full Prism Farm season!
Who would want to sell their xPRISM?
Have they lost their mind?
Or better: have their lost their AMPs?
(which is what I'm interested in, being a Prism Farm participant)
However, we can try to understand more of what happened:
- How many users sold their tokens?
- How many bought?
- Who are these users? Had they participated in the lockdrop?
Let me show u what I found 🧵
Let's start with some numbers:
Number of ASTRO tokens sold/bought
- 19.3m ASTRO tokens were sold
- 8.5m ASTRO tokens were bought
A net of 10.7m ASTRO tokens were sold on the market
Sold and bought over time
The chart shows a strong selling pressure right at launch and an equilibrium between sell/buy which has slowly stabilized over time. At launch the price was $2.7, probably deemed by many users as a good price to take profit for on their unlocked $ASTRO.
I looked into some of users behaviours and patterns
- What have users decided to deposit?
- How much UST have users performed?
- What have Phase 1 top depositors deposited in Phase 2?
Let's dive into what the on-chain data shows 🧵👇
First of all:
- 18109 total users have participated in Phase 2 of the lockdrop.
What about the users who participated in Phase 1?
⚠️ More than 40% of users from Phase 1 who have not deposited anything in Phase 2. This means these users have ASTRO tokens unlocked, free to be sold on the market as soon as the DEX goes live ⚠️
The recent days have seen some volatility in the bLuna-Luna pair.
This presents some arbitrage opportunities.
How often do these occur?
When should you take advantage of them?
When should you not?
This is what we are going to explore in this 🧵
What is arbitrage?
Arbitrage, in the case of AMM and Liquidity Pools, can occur when the unbalance in the pool allows one token to be traded cheaper than it should. In that case arbitrageurs can take advantage of this unbalance and restore balance while making a profit
What is bLuna?
Anchor protocol allows users to deposit (bond) their Luna — gets staked — and obtain a liquid token: bLuna. This bLuna gives right to the staking yields of the underlying Luna and can be unbonded back to Luna via Anchor. The unbonding period usually takes 21 days