#ChelseaFC publish accounts for year ended 30 June 2021: Key Numbers
Operating loss £155m (£32m profit in 2020)
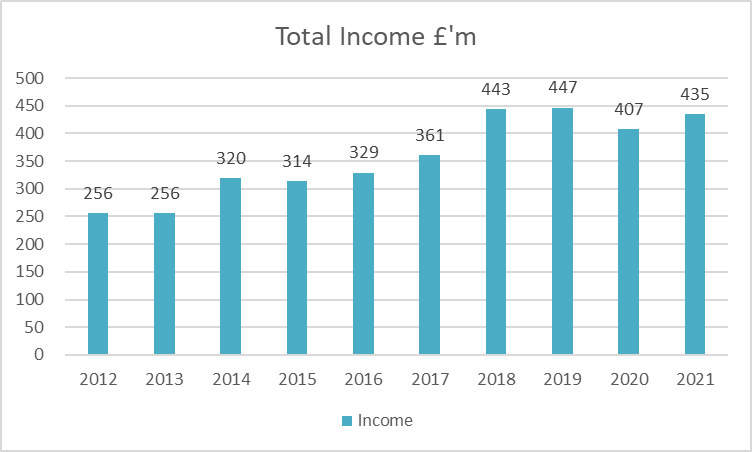
Income up 7% to £435m
Wages up 17% to £333m
Ave Weekly wage £155k
Squad cost £959m
Owed to Abramovich £1.4 billion
Income increased despite season BCD due to more matches taking place as end of 2019/20 season was partially in year to 30 June 2020 following Project Restart.
Matchday income fell by 86% due to matches taking place BCD
Broadcast income up 69% due to more matches being played and success in winning the Champions League
Commercial income fell by 19% to £154m due to loss of pre-season tours, non-match day income (such as John Terry showing fans around the training facilities) and fewer players out on loan.
Wages up £50m due to recruitment, new contracts and bonuses for winning the CL. Average wage over £155k a week, wages £77 for every £100 of income.
Chelsea's highest paid director earned £2.24m
Transfer fee amortisation (transfer fees spread over contract life) up to £163m following significant recruitment in 2020/21.
As a result of costs rising faster than income Chelsea went from an operating profit of £32m to a loss of £155m. These figures have been very erotic in recent years due to the volatile one off costs and income streams.
Player sale profits fell from £143m to £28m as only main sales were Victor Moses and fan favourite Nathan De Souza
Chelsea also had player write downs of £17m and a legal claim of £24m (may be related to a manager compensation case)
Chelsea spend £221m on new players in 2020/21 taking total spend to over £1.5 billion in last decade.
Chelsea had player sales of £31m in 2020/21
Chelsea's net spend was therefore £189m
Chelsea's squad cost £959m by 30 June 2021, signing of Lukaku will have taken that beyond £1 billion, which possibly explains why they had to put out a threadbare team last night against Brighton.
Roman Abramovich has loaned almost £1.4 billion to parent company Fordstam Ltd.
Excluding player sales and one-off costs Chelsea's EBIT losses (Earnings before interest and tax) were a record £141m in 2020/21, taking the total to £731m in last decade, which explains why player sales and RA are so important to the club.
Only three clubs have published (Man Utd, Spurs and Chelsea) have published results for 2020/21 to date, but Chelsea are inbetween those two clubs, both of whom in a normal year would generate £40-50m mroe from matchday income
Chelsea's wage bill higher than that of Manchester United, but they did win a trophy in 2020/21 which will have triggered bonuses. Substantially highest wages of London clubs.
Again difficult to get a full picture as so few clubs have reported yet for 2020/21 but Chelsea's day to day losses of £141m contribute to overall PL losses of over £1.4bn
Chelsea have second highest squad cost in the PL, just behind that of Manchester City. This may have helped those clubs reach the Champions League final earlier this year
• • •
Missing some Tweet in this thread? You can try to
force a refresh
A history of Premier League transfer spending. First season (1992/93) total spend was £65m and QPR spent just £197k. Newly promoted Blackburn were the biggest spenders due to Jack Walker's investment in the likes of Alan Shearer, Stuart Ripley, Kevin Gallagher & Graham Le Saux.
1993/94 spending up to £78m. Blackburn continue to be the biggest spenders, Champions Manchester United were outspent by...err...Swindon.
First £100m spend season, Everton became the first team to eight figures spent in a season with Ferguson, Samways, Amokachi and Barrett all joining the club on big deals. QPR again smallest spenders. Man City and Chelsea outspent by Wimbledon.
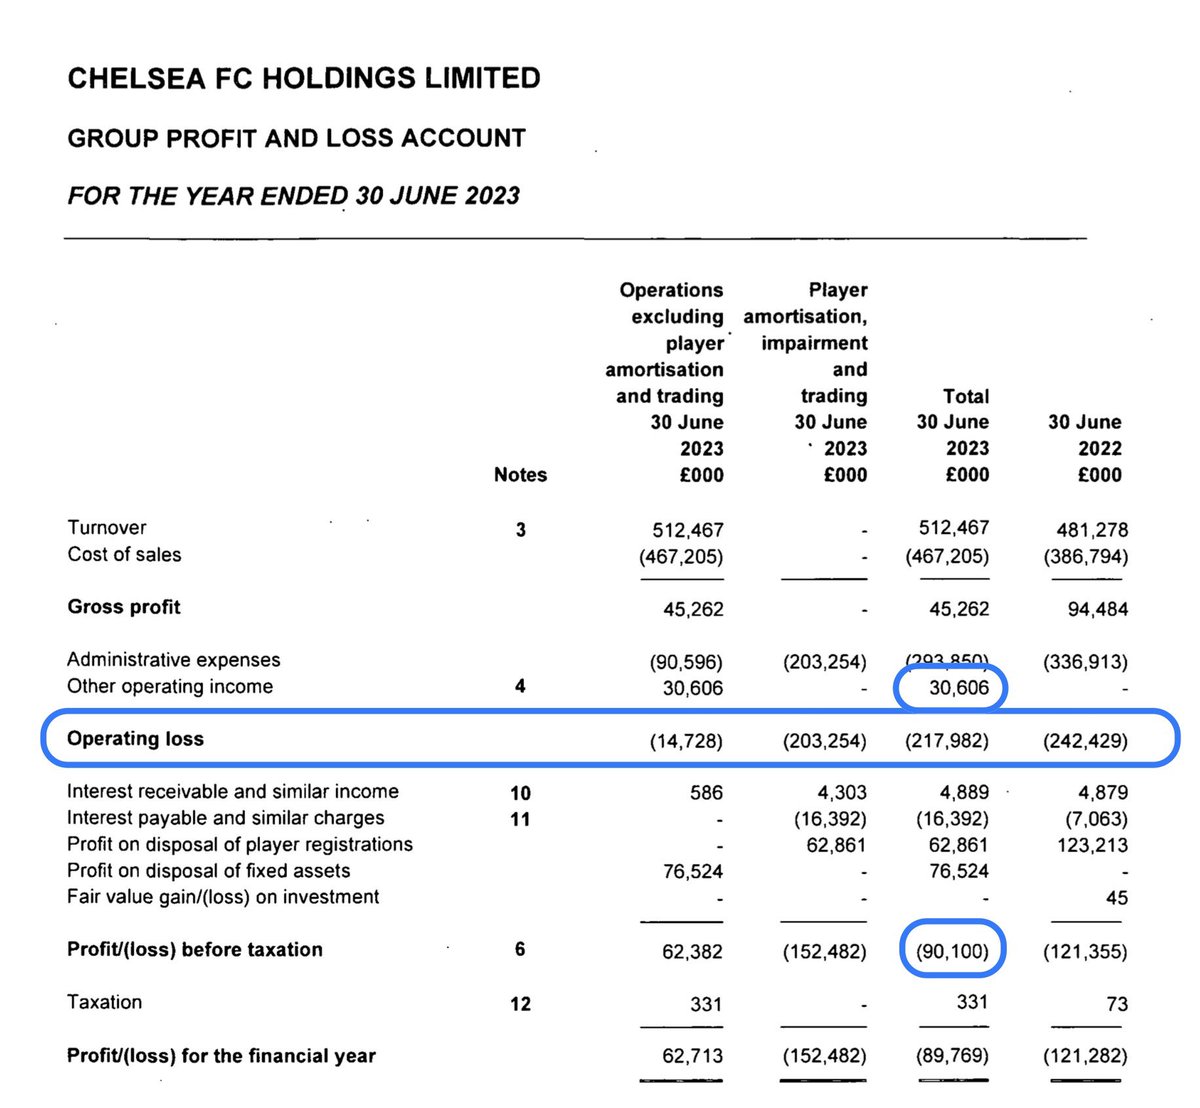
Chelsea FC Holdings submit 22/23 accounts. 🔑 figs
⚽️Revenue £512m ⬆️ 6%
⚽️Wages £404m ⬆️ 18%
⚽️Player costs (wages & amortisation) £119 for every £100 of revenue
⚽️Day to day losses £249m
⚽️Player purchases £745m
⚽️Player sales £203m
⚽️Borrowings in year £428m
Losses ⬆️ from £242m to £249m for day to day running of club but sale of hotel to another part of group, £30m of financial settlements & player sales ⬇️ this to £90m
Chelsea have cash in bank, total losses adding all the years together now £1.135 billion
Whilst #Rovers 🔑 revenue streams, matchday, broadcast & commercial all ⬆️ significantly. However general overheads ⬆️ too which meant no change to op losses. Sale of Armstrong in 21/22 halved losses
Both accounts & audit report reference that there is a material uncertainty over ability of club to trade as a going concern. Should no noted that audit report dated December 2023 & things may have improved since then
Burnley publish 22/23 accounts; 🔑 figs
Revenue £65m ⬇️ 47%
Wages £54m ⬇️ 42%
Loss pre player sales £41m
Player purchases £84m
Player sales £21m
Borrowings £101m
Big change in pre tax profit of £36m in 21/22 to a loss of £36m in 22/23. Mainly due to ⬇️ in revenue following relegation and player sale profits ⬇️ from £54m to £11m.
Burnley still have substantial cash but this due to the Club borrowing substantial amounts during the year as liabilities ⬆️. Burnley still profitable over the years.
Leicester announce 22/23 accounts for 13 months to 30 June. 🔑 figs
Revenue £177m ⬇️ 17%
Wages £206m ⬆️ 13%
Loss pre player sales £152m ⬆️ 91%
Player sale profits £75m
Player purchases £53m
Player sales £104m
Extending financial year from 31 May to 30 June allowed Leicester to squeeze in sales of Maddison but pre tax loss (start point for PSR) still £90m.
Leicester total losses over the years now £295m. Liabilities ⬇️ after owner converted loans into shares.
Everton publish 22/23 accounts: 🔑 figs
Revenue £172m ⬇️ 5%
Wages £159m ⬇️ 2%
Amortisation £77m ⬆️ 23%
Manager/coaching payoff £7m
Executive payoff £2.5m
Loss pre player sales £130m
Pre tax loss £89m
Player signings £91m
Player sales £61m
Borrowings £341m
Losses ⬆️ due to no longer having Usmanov sponsor deals, wage ⬇️ modest & interest costs doubling
Cash balance down as club dealing with significant monthly demands in terms of meeting payroll and new stadium costs. Total losses over the years now £550m