
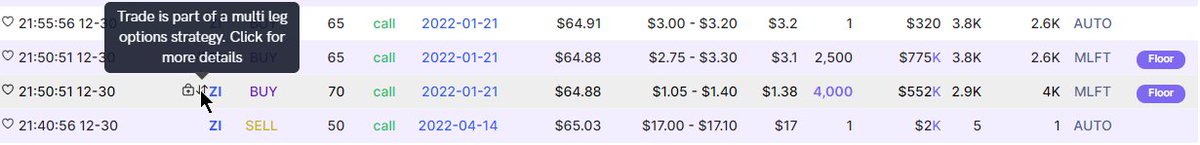
$ZI - 🌊🔍 Flow Deep Dive per @unusual_whales 📆📈 - No filters on the below post. Highlighted the unusual trade I am going to look into, the 4K and 2.5K contracts on the $70 and $65 strike call options for 21-Jan.
TL;DR: I think they rolled their strike up and bought more.
TL;DR: I think they rolled their strike up and bought more.


Click on the ↕ emoji (where my cursor is) to view the trades that came in together (potentially) as a part of a strategy.
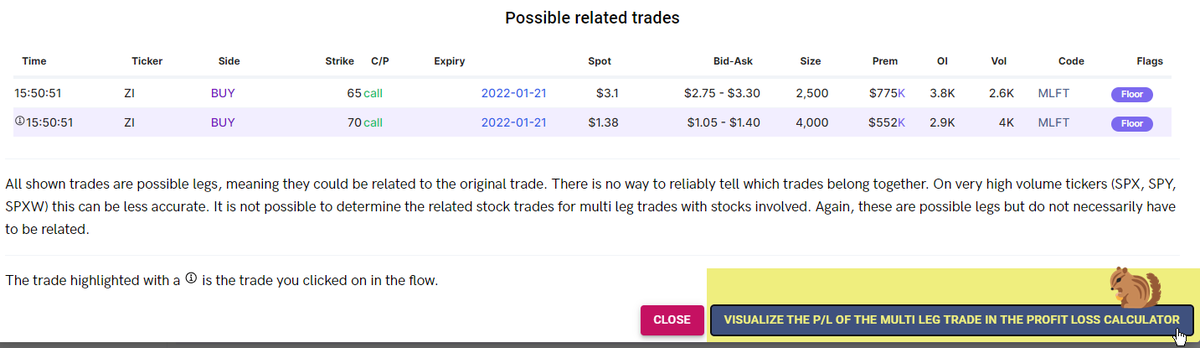
That opens up this panel which shows us the relevant trades that came in together.
On the $65C, we can see that the volume on the day was about the size of this order in fact, but the open interest was 3.8K...so we simply cannot know if they were bought or sold to open.
On the $65C, we can see that the volume on the day was about the size of this order in fact, but the open interest was 3.8K...so we simply cannot know if they were bought or sold to open.

However, the $70C's 4K contracts was well above the 2.9K, so we can be confident these were bought or sold to open.
This determination is made if the size of the trade was greater than the chain's open interest. It's that easy!
This determination is made if the size of the trade was greater than the chain's open interest. It's that easy!
If you click on the expirations beneath the squirrel (highlighted), another panel will open up showing you the historical volume and open interest for that options chain.
By the way! You can click on any expiration *almost* anywhere in the flow to open this next panel.
By the way! You can click on any expiration *almost* anywhere in the flow to open this next panel.

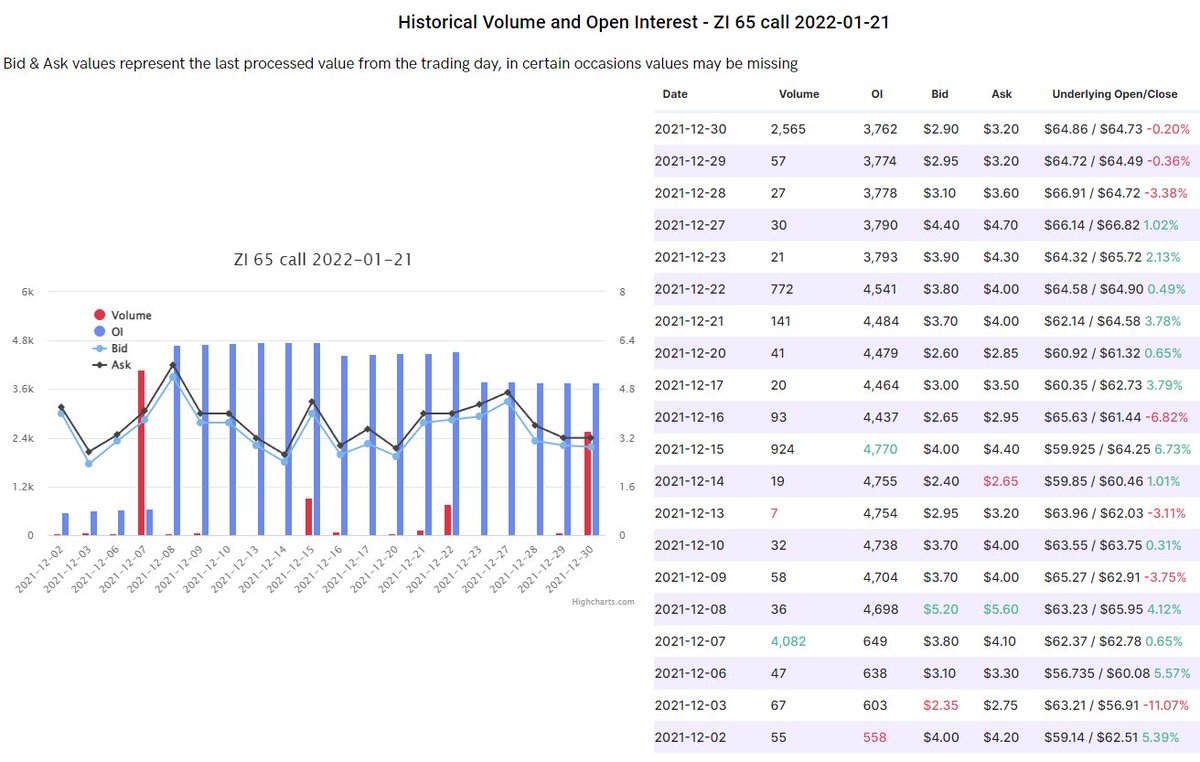
As we can see, in the $70 strike call for 21-Jan, it had an influx of volume on 14-Dec, but has steadily been around 2.5K OI, give or take, until today.
Tomorrow we can see just how much higher the OI goes (we should expect to see it around about 6.5K).
Tomorrow we can see just how much higher the OI goes (we should expect to see it around about 6.5K).

The $65 strike for 21-Jan, however, paints a different picture.
It had 4K volume on 7-Dec, but has remained around 4Kish (dropping to 3.7K) OI since then. Today's 2.5K was not enough to signify if this was an entry or exit.
It had 4K volume on 7-Dec, but has remained around 4Kish (dropping to 3.7K) OI since then. Today's 2.5K was not enough to signify if this was an entry or exit.

OK, so, we *DO* know these orders came in together, though. But the volumes were not even, as in this was not a *symmetrical* order. Why might that be?
Go back to the previous panel and click on "Visualize the P/L of the multileg..." button, which I squirreled again for you.
Go back to the previous panel and click on "Visualize the P/L of the multileg..." button, which I squirreled again for you.
That opens the UW Options Profit Calculator.
You'll see this, but... This isn't quite right.
As stated, this is asymmetrical *and* the volume on the $65C was not over OI.
Floor traders making completely OTM, naked bets?
Willing to lose 1.3M on a gamble? I think not!
You'll see this, but... This isn't quite right.
As stated, this is asymmetrical *and* the volume on the $65C was not over OI.
Floor traders making completely OTM, naked bets?
Willing to lose 1.3M on a gamble? I think not!

Review my thread on why I doubt floor traders be setting up in such a way here:
From that thread, you will read that there is a low statistical chance that is what is happening (floor traders taking on an OTM position as this for such a timeframe).
https://twitter.com/Crowd_Traders/status/1476598973347643397
From that thread, you will read that there is a low statistical chance that is what is happening (floor traders taking on an OTM position as this for such a timeframe).
So now that we know this, I think this trader is just ROLLING their contracts up to a higher strike.
Am I right? I don't know yet! We will see at tomorrow's open with the changes to OI.
Am I right? I don't know yet! We will see at tomorrow's open with the changes to OI.
This is but a walkthrough on how to figure this out for yourself so that you do not follow a bet that might actually not be *quite as bullish* as you were led to believe at first.
Let me know if this helped and I will gladly write out more guides!
Let me know if this helped and I will gladly write out more guides!
Rolling a strike just means they are closing their current position and then buying new contracts at a higher strike.
(You can also roll out expirations, so close current expiration, and then buy same strike later expirations, same meaning).
This implies they are still believing in their original thesis, and the trade is still "on" so to speak.
This implies they are still believing in their original thesis, and the trade is still "on" so to speak.
• • •
Missing some Tweet in this thread? You can try to
force a refresh


