A Thread (🧵) on India's Digital payments system and banking sector.
Let's start - India’s digital payments ecosystem has undergone a huge transformation with events like
demonetization and the COVID-19 pandemic necessitating a more efficient, user-friendly
1/n
Let's start - India’s digital payments ecosystem has undergone a huge transformation with events like
demonetization and the COVID-19 pandemic necessitating a more efficient, user-friendly
1/n
and cost effective interface.
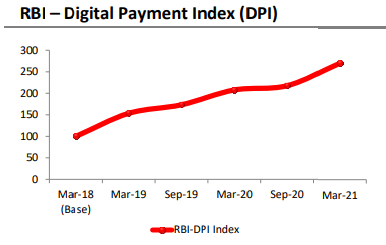
The RBI’s digital payment index (RBI – DPI) almost tripled to 271 in FY21 from the base year of
FY18.
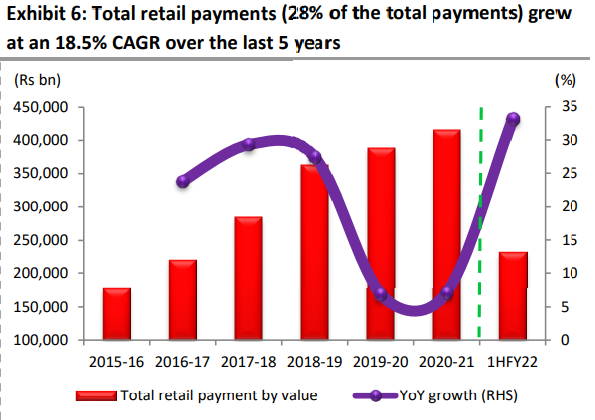
The digital transactions value stood at Rs 147trn in FY21, of which large credit transfers is 72%
& Retail payments - 28%
2/n
The RBI’s digital payment index (RBI – DPI) almost tripled to 271 in FY21 from the base year of
FY18.
The digital transactions value stood at Rs 147trn in FY21, of which large credit transfers is 72%
& Retail payments - 28%
2/n
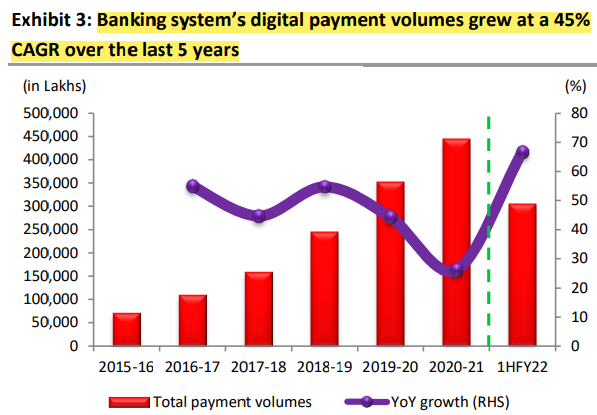
In value terms, total payments grew at a
CAGR of 11% in FY12-20 but declined in FY21 due to the pandemic.
In volume terms total payments grew at a CAGR of 44.5% during FY19-21.
3/n
CAGR of 11% in FY12-20 but declined in FY21 due to the pandemic.
In volume terms total payments grew at a CAGR of 44.5% during FY19-21.
3/n
Digital Payments Market – Retail payments gain market share
First let's understand the difference between Retail payments and Large credit transfer.
Retail payments are typically payments between consumers, businesses and public authorities. They can be everyday consumer.
4/n
First let's understand the difference between Retail payments and Large credit transfer.
Retail payments are typically payments between consumers, businesses and public authorities. They can be everyday consumer.
4/n
And a credit transfer is a direct payment of money from one bank account into another (RTGS)
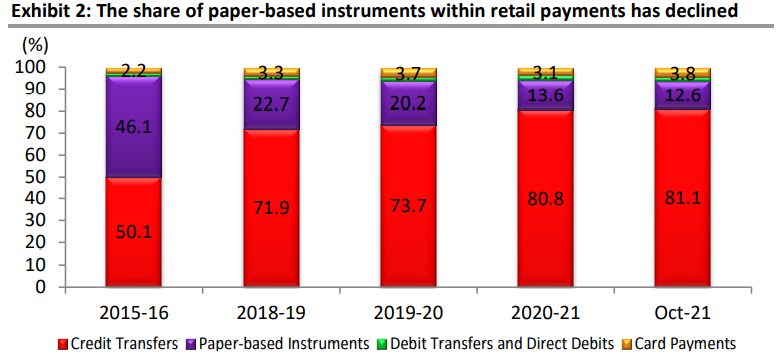
Total retail payments grew at a 13.4% CAGR during FY18-FY21
compared to the contraction of 3.3% in large credit transactions over the same
period.
5/n
Total retail payments grew at a 13.4% CAGR during FY18-FY21
compared to the contraction of 3.3% in large credit transactions over the same
period.
5/n
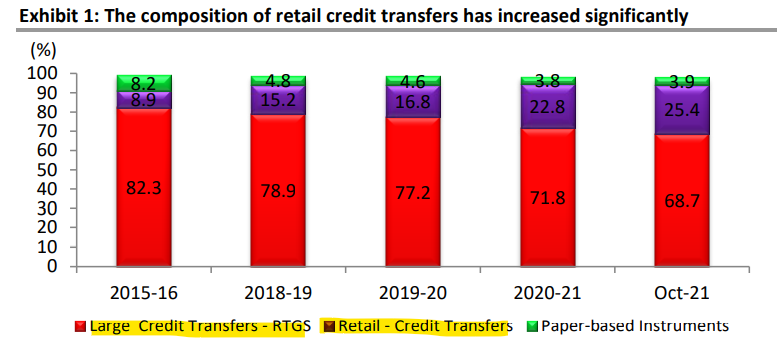
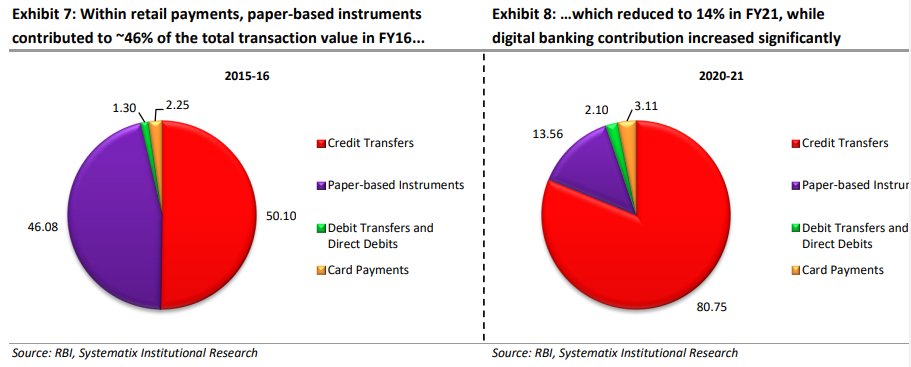
Paper-based instruments transactions declined by 11.8% over the period.
6/n
6/n
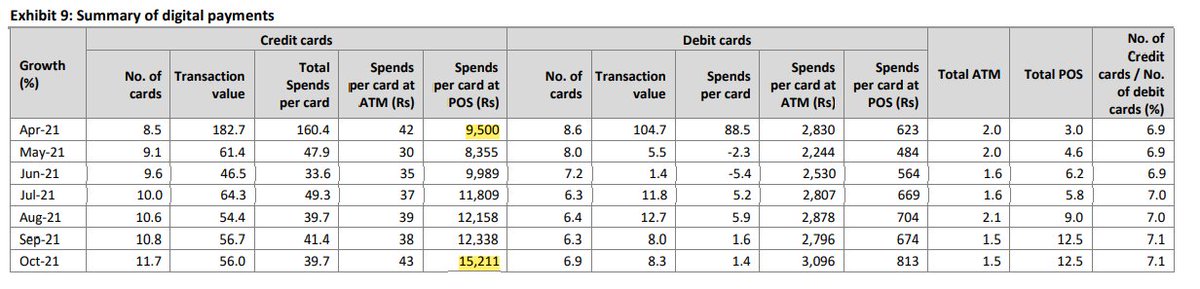
Now let's take a look at Credit card & Debit cards transaction.
Spends per card (Credit card) at POS (Point of sale) increased from 9,500rs to 15,211rs (Indicating more people are using credit cards for payments at malls etc)
7/n
Spends per card (Credit card) at POS (Point of sale) increased from 9,500rs to 15,211rs (Indicating more people are using credit cards for payments at malls etc)
7/n
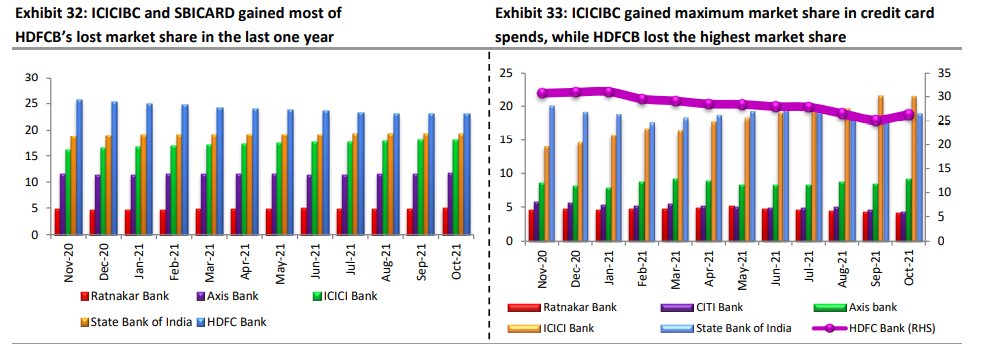
ICICI Bank has benefitted the most from the ban on HDFC bank.
ICICI bank increased it's market share to 18% and will most probably surpass SBI.
On the other hand HDFC lost market share but now they can issue cards again and have started recovering the lost ground.
8/n
ICICI bank increased it's market share to 18% and will most probably surpass SBI.
On the other hand HDFC lost market share but now they can issue cards again and have started recovering the lost ground.
8/n
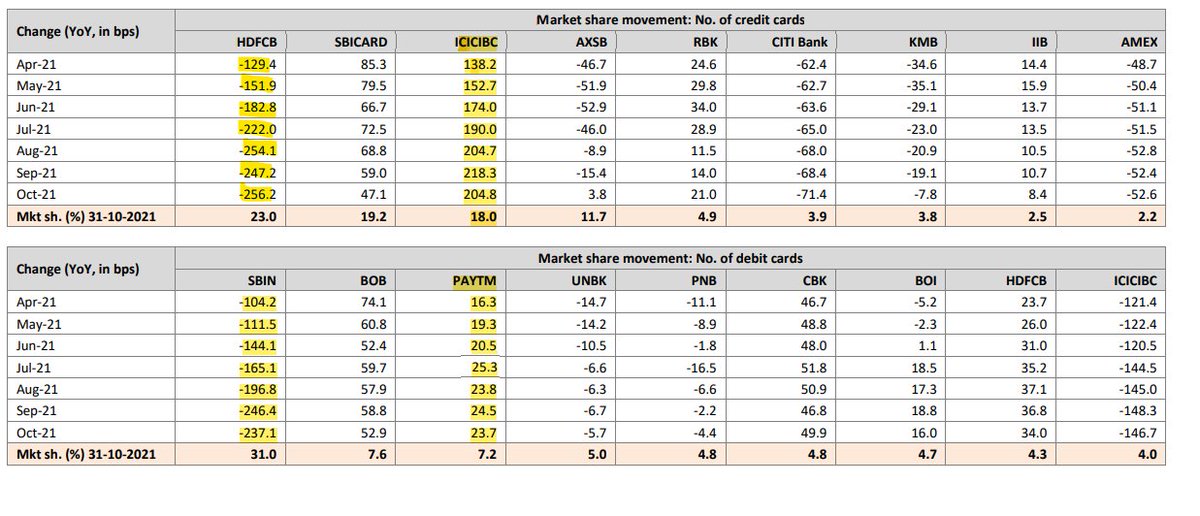
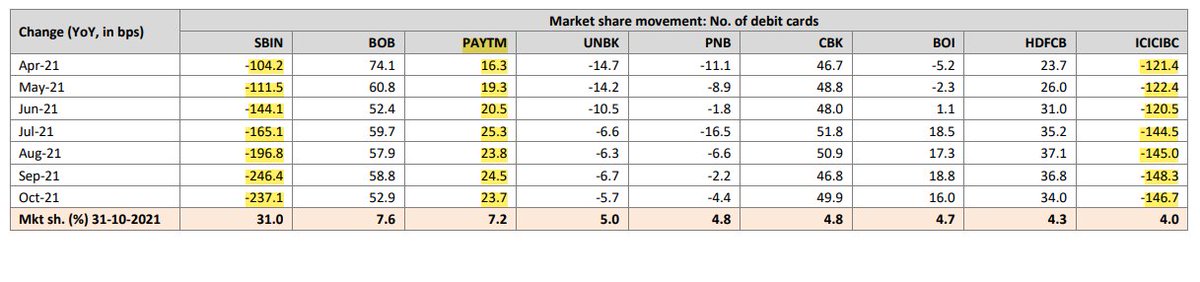
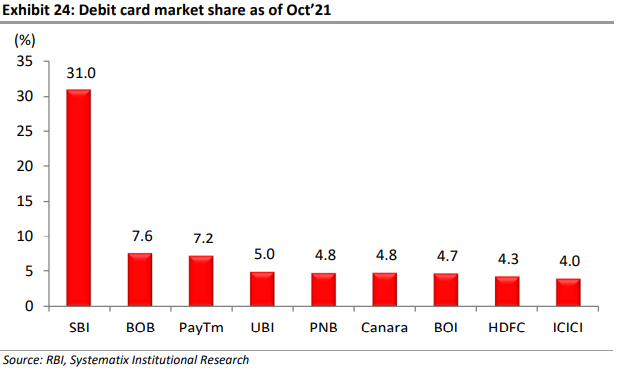
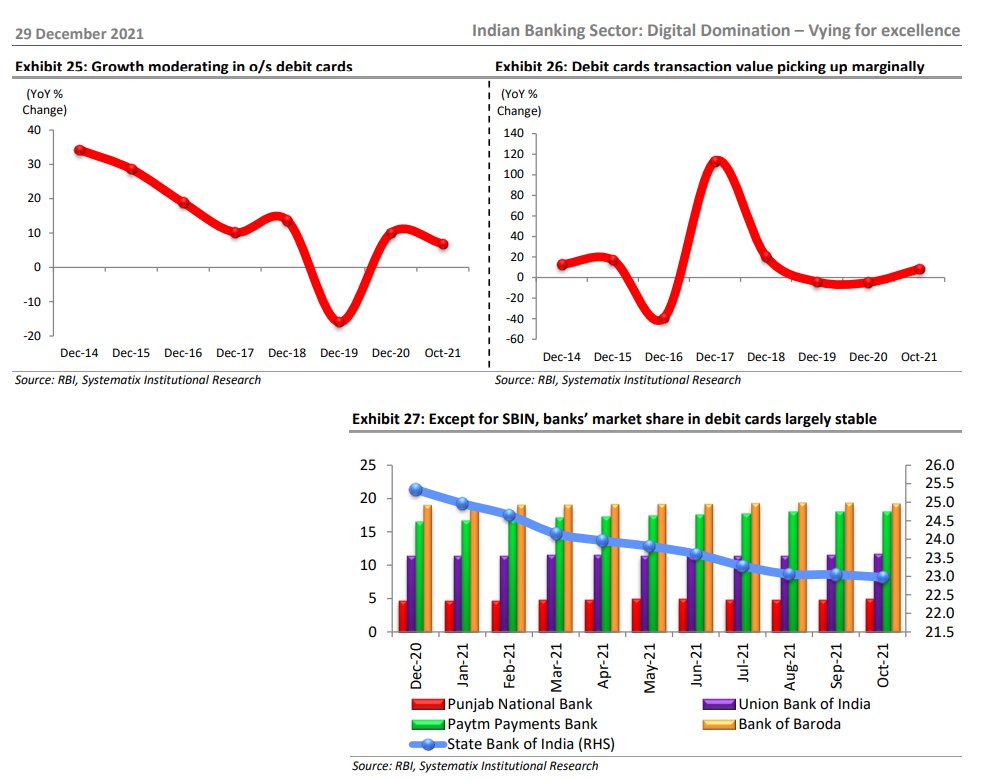
And in case of Debit cards, PAYTM is the clear winner on the other hand SBI & ICICI are losing market share in case of debit cards.
9/n
9/n
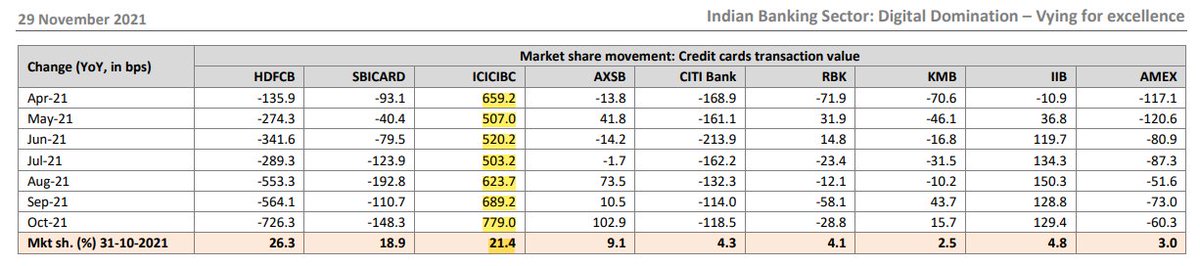
In terms of Transaction value, ICICI is growing at a much much faster rate and it's market share increased to 21.4%.
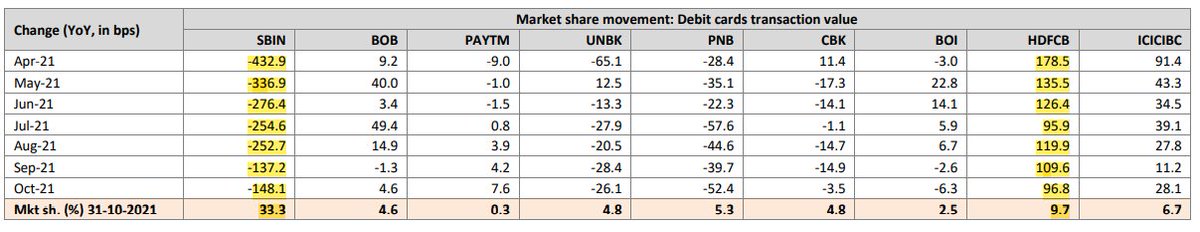
And in case of debit cards, HDFC is the clear winner.
10/n
And in case of debit cards, HDFC is the clear winner.
10/n
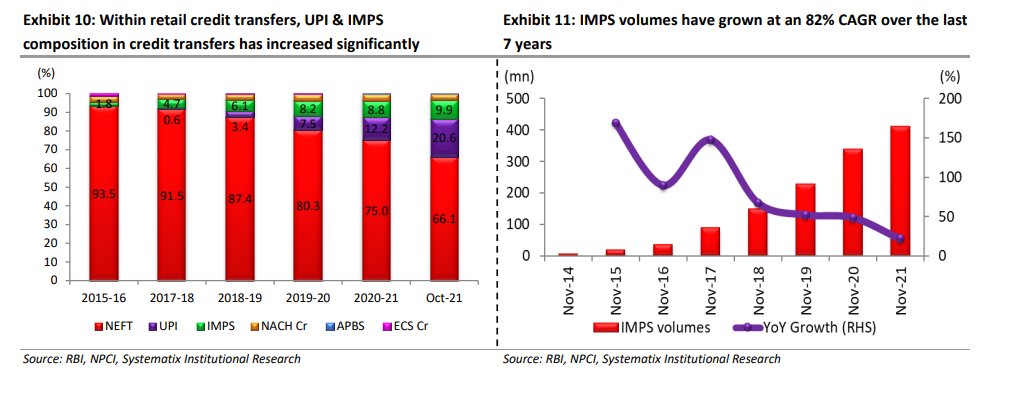
UPI & IMPS taking market share from other modes of payment ( NEFT, cards, cash).
NEFT (national electronic funds transfer) remains the preferred mode of payment within
credit transfers, but its proportion contracted to 53.6% in Oct’21 from 87.4% in FY19.
11/n
NEFT (national electronic funds transfer) remains the preferred mode of payment within
credit transfers, but its proportion contracted to 53.6% in Oct’21 from 87.4% in FY19.
11/n
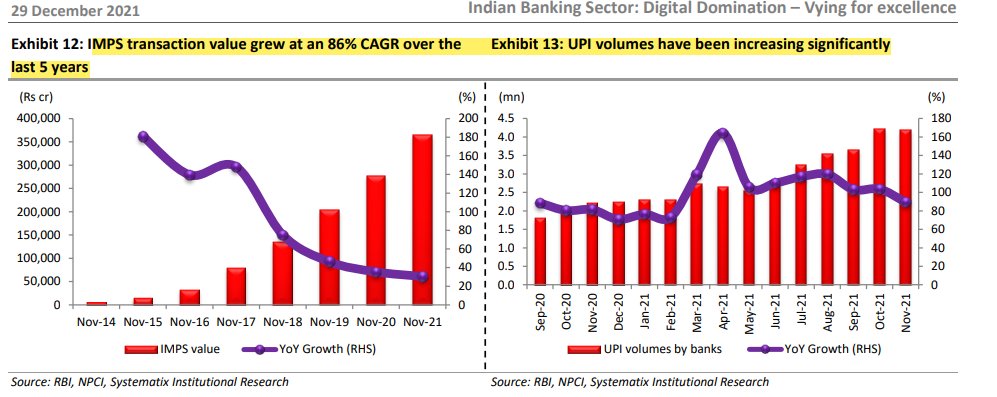
UPI & IMPS (immediate payment service) transaction volumes grew at a CAGR of 95.6% & 32.8% during Sep’19-Sep’21, with a substantial increase in their proportions to 20.6% & 9.9% in Oct’21 from 3.4% & 6.1% in FY19, respectively.
12/n
12/n
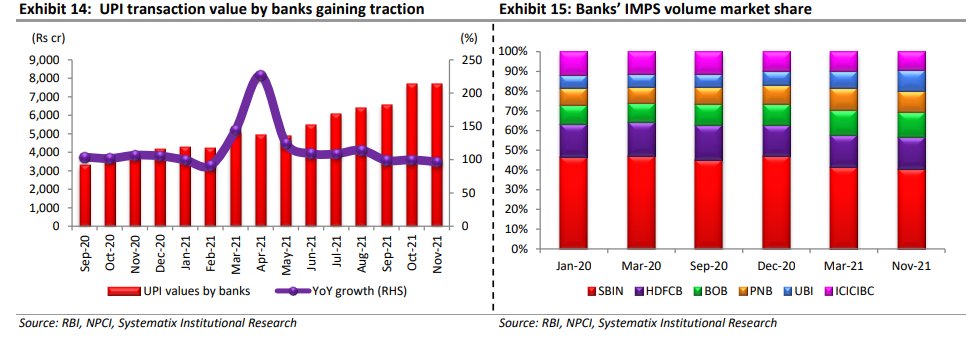
Amongst UPI remitter banks, SBIN is the market leader with a 26.4% market share,
followed by HDFCB (8.4% market share). The top-6 banks together control ~58% of
the UPI volumes.
SBIN is the leader in the IMPS domain with a 22.4% market share in volume terms
13/n
followed by HDFCB (8.4% market share). The top-6 banks together control ~58% of
the UPI volumes.
SBIN is the leader in the IMPS domain with a 22.4% market share in volume terms
13/n
RTGS (real-time gross settlement) volumes grew at a CAGR of 17.3% over Nov’19 to
Oct’21, but the transaction value ticket size witnessed a sharp decline at a CAGR of
8.5% during the same period.
14/n
Oct’21, but the transaction value ticket size witnessed a sharp decline at a CAGR of
8.5% during the same period.
14/n
The average ticket size has dropped to Rs 5.5lakhs in the post-pandemic period from
Rs 7.2lakhs in the pre-pandemic period.
HDFC is a market leader in terms of volume & value and is ahead of SBIN with a
reasonable gap.
15/n
Rs 7.2lakhs in the pre-pandemic period.
HDFC is a market leader in terms of volume & value and is ahead of SBIN with a
reasonable gap.
15/n
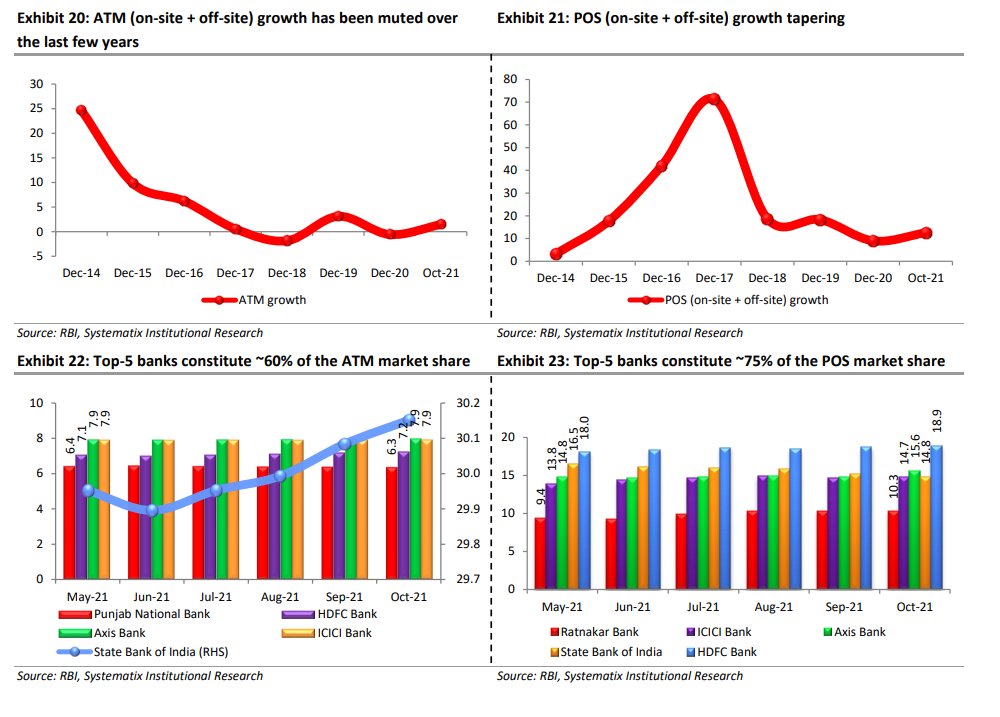
The story of POS terminals is not very different in terms of network expansion; the number of POS terminals grew at a CAGR of just 3.4% to 51.6lakhs during Oct’19-Oct’21.
HDFCB and RBK have lost market shares, while AXSB, ICICIBC and IIB have gained market share.
16/n
HDFCB and RBK have lost market shares, while AXSB, ICICIBC and IIB have gained market share.
16/n
Debit card transactions – Ticket size rises, frequency declines
The banking system’s debit card base has grown at a CAGR of 5.2% in the last two
years to 934mn as of end-Oct’21. Debit card transactions (in value terms) declined at
a CAGR of 2.7% during the period
17/n
The banking system’s debit card base has grown at a CAGR of 5.2% in the last two
years to 934mn as of end-Oct’21. Debit card transactions (in value terms) declined at
a CAGR of 2.7% during the period
17/n
18/n
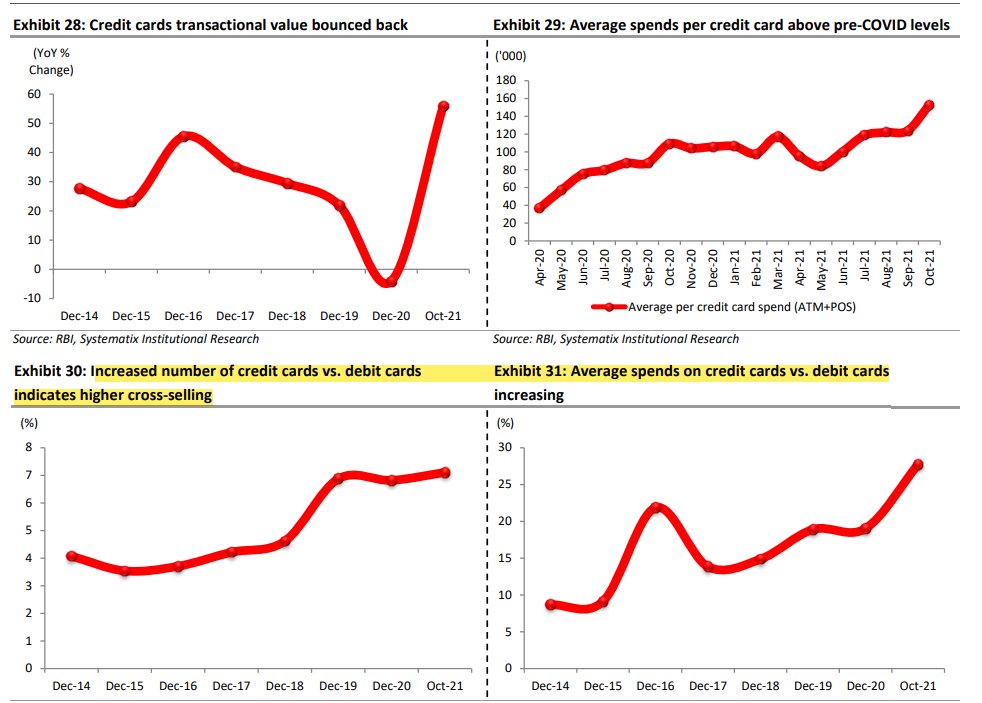
Credit card usage rising faster than debit cards.
In the retail payments ecosystem, the composition of card payment transactions declined to 3.1% in FY21 compared to 3.3%/3.7% in FY19/FY20, respectively The composition inched up to the pre-pandemic level of 3.85% in Oct’21
19/n
In the retail payments ecosystem, the composition of card payment transactions declined to 3.1% in FY21 compared to 3.3%/3.7% in FY19/FY20, respectively The composition inched up to the pre-pandemic level of 3.85% in Oct’21
19/n
The banking industry’s credit card customer base expanded at a CAGR of 11.5%
CAGR during Oct’19-Oct’21 to 66mn, and in value terms, credit card spending
increased by 19% during the period to Rs 1.0trn in Oct’21.
20/n
CAGR during Oct’19-Oct’21 to 66mn, and in value terms, credit card spending
increased by 19% during the period to Rs 1.0trn in Oct’21.
20/n
Credit card spending has surpassed the average pre-pandemic level of Rs 12,000 per
card during Dec’19-Jan’20, with per credit card spending at Rs 15,274 in Oct’21.
21/n
card during Dec’19-Jan’20, with per credit card spending at Rs 15,274 in Oct’21.
21/n
22/n
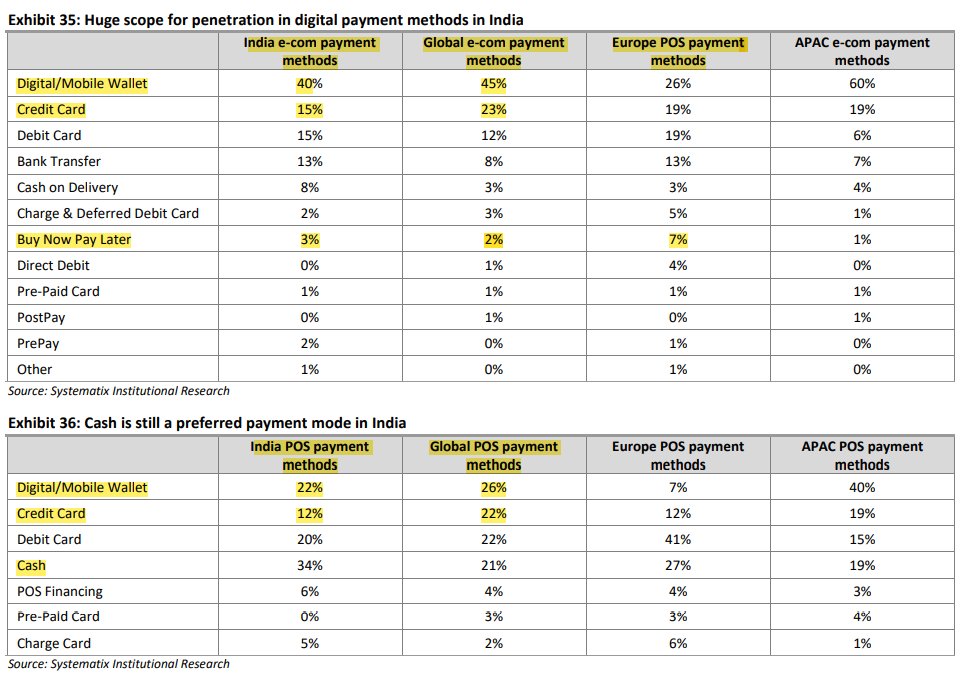
INDIA VS GLOBAL Average
Cash is still prefered mode of transaction in India,
34% in case of POS vs 21% in case of Global.
23/n
Cash is still prefered mode of transaction in India,
34% in case of POS vs 21% in case of Global.
23/n
Special thanks to @shubhfin for sharing the report.
Please share and Re-tweet for wider reach.
• • •
Missing some Tweet in this thread? You can try to
force a refresh