
How are effects of online A/B tests distributed? How often are they not significant? Does achieving significance guarantee meaningful business impact?
We answer these questions in our new paper, “False Discovery in A/B Testing”, recently out in Management Science >>
We answer these questions in our new paper, “False Discovery in A/B Testing”, recently out in Management Science >>
The paper is co-authored with Christophe Van den Bulte and analyzes over 2,700 online A/B tests that were run on the @Optimizely platform by more than 1,300 experimenters.
Link to paper: pubsonline.informs.org/doi/10.1287/mn…
Non paywalled: ron-berman.com/papers/fdr.pdf
>>
Link to paper: pubsonline.informs.org/doi/10.1287/mn…
Non paywalled: ron-berman.com/papers/fdr.pdf
>>
A big draw of the paper is that @Optimizely have graciously allowed us to publish the data we used in the analysis. We hope this would be valuable to other researchers as well.
>>
>>
First, we analyze the effects of all the A/B tests in our data. They are quite small. The median (and average) webpage variations have roughly zero effect on webpage Engagement.
But the distribution is quite long-tailed with some variations showing big effects.
>>
But the distribution is quite long-tailed with some variations showing big effects.
>>

We then classify effects into “null” (zero) and “non-null” (pos or neg), to understand how many experiments, on average, have an underlying zero effect.
The answer is about 70%.
That is, 70% of effects will not show any impact on Engagement compared to a baseline.
>>
The answer is about 70%.
That is, 70% of effects will not show any impact on Engagement compared to a baseline.
>>
The concept of a true null is somewhat subtle (as we explain in the paper), since we often assume that true-nulls don’t exist.
However, as long as we test for a null hypothesis of a true null using significance testing, there is no reason to assume the null cannot be true.
>>
However, as long as we test for a null hypothesis of a true null using significance testing, there is no reason to assume the null cannot be true.
>>
70% true nulls just means that if one picks a random webpage variation in our data, it has a high chance of yielding no (or very small) impact.
But what about the statistically significant effects? Wouldn’t they guard us from true nulls by having a low false positive rate?
>>
But what about the statistically significant effects? Wouldn’t they guard us from true nulls by having a low false positive rate?
>>
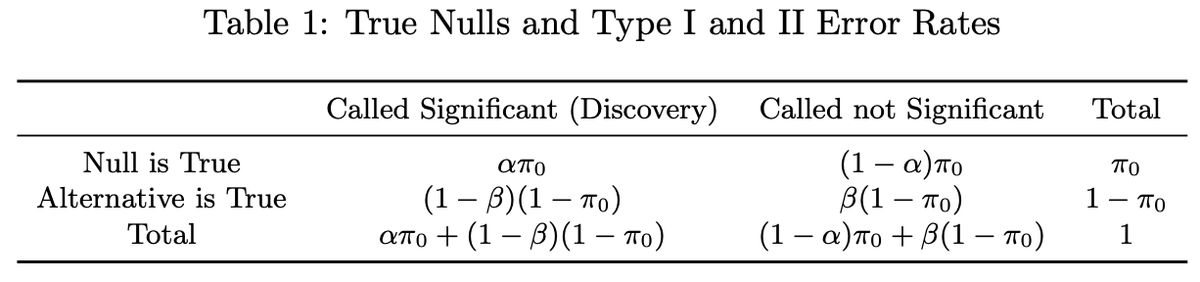
A statistically significant result generated by a true null effect is called a false discovery. Although we often think of the significance threshold we set for hypothesis testing (e.g., alpha=0.05) as the rate of false discoveries, this is not actually what we get.
>>
>>
alpha is the false positive rate (FPR), or
Pr(effect is significant | effect is null).
We care about the opposite,
Pr(effect is null | effect is significant),
which is called the false discovery rate (FDR).
>>
Pr(effect is significant | effect is null).
We care about the opposite,
Pr(effect is null | effect is significant),
which is called the false discovery rate (FDR).
>>
Our analysis shows that in our data, hypothesis tests conducted with alpha=0.05 yield an FDR of 18%-25%.
Much higher than 5%.
That is, about 20% of significant effects chosen for implementation will not generate the business impact that was observed in the experiment.
>>
Much higher than 5%.
That is, about 20% of significant effects chosen for implementation will not generate the business impact that was observed in the experiment.
>>

We use multiple methods to estimate the rate of true nulls and the FDR, but one was particularly fun to learn about, as it was developed to estimate false discoveries in genomewide studies. You can read about it here: pnas.org/content/100/16….
>>
>>
Our paper estimates the business costs of these false discoveries, and discusses and tests possible solutions that firms can implement. The details are a bit beyond the scope of this thread, but we hope that the paper with the accompanying data and code will prove useful.
>>
>>
Generally, firms should try to test more radical variations in order to have larger impact on consumer behavior (we call this “swing for the fences”). Most variations will probably not be very impactful, but once in a while an innovation will prove to be very lucrative.
(Fin)
(Fin)
P.S. I didn't go into all details, minutiae, caveats and disclaimers in the paper. There is much more, and I would love for people to read it.
• • •
Missing some Tweet in this thread? You can try to
force a refresh


